clockwork_spider
Participant
October 26, 2020
Answered

Display less values in the X-axis of an area graph

  • October 26, 2020
  • 2 replies
  • 499 views

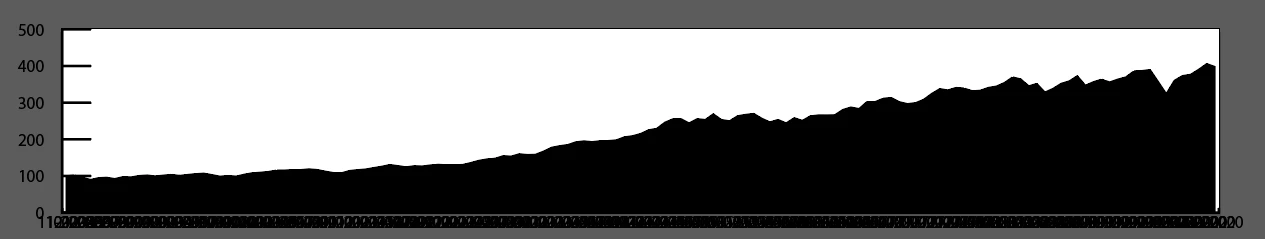
I'm making an area graph showing changes through the years and have data for each month. But as you can see from the x-axis, there's no use labelling each month on the x-axis. Is there a quick way on illustrator to only display 1/12 X-axis labels? 

Thanks. 


This topic has been closed for replies.
Correct answer Kurt Gold

Thank you for the sample file.


You may already have discovered that Illustrator's graph technologies are rather nostalgic highlights that once were breathtaking in 1995.


Apart from that, you could just modify the entries in the first column of your graph data, such that it would only show the desired months or years.


2 replies

Kurt Gold
Community Expert
Kurt GoldCommunity ExpertCorrect answer
Community Expert
October 27, 2020

Thank you for the sample file.


You may already have discovered that Illustrator's graph technologies are rather nostalgic highlights that once were breathtaking in 1995.


Apart from that, you could just modify the entries in the first column of your graph data, such that it would only show the desired months or years.


clockwork_spider
Participant
October 27, 2020

Oh damn... I have a really long list of data and was hoping it wouldn't come to that. Thanks for the help. 

Kurt Gold
Community Expert
Community Expert
October 26, 2020

Can you share this sample Illustrator file (.ai)?


clockwork_spider
Participant
October 26, 2020

Thanks for the reply Kurt. The numbers in the file is a bit sensitive. Let me quickly make a file with random numbers (just to be safe). 

https://we.tl/t-LB3toRL1A0


What I want to do is to show only a certain intervals of X-axis labels.