Answered
Illustrator Graphs/Charts tool
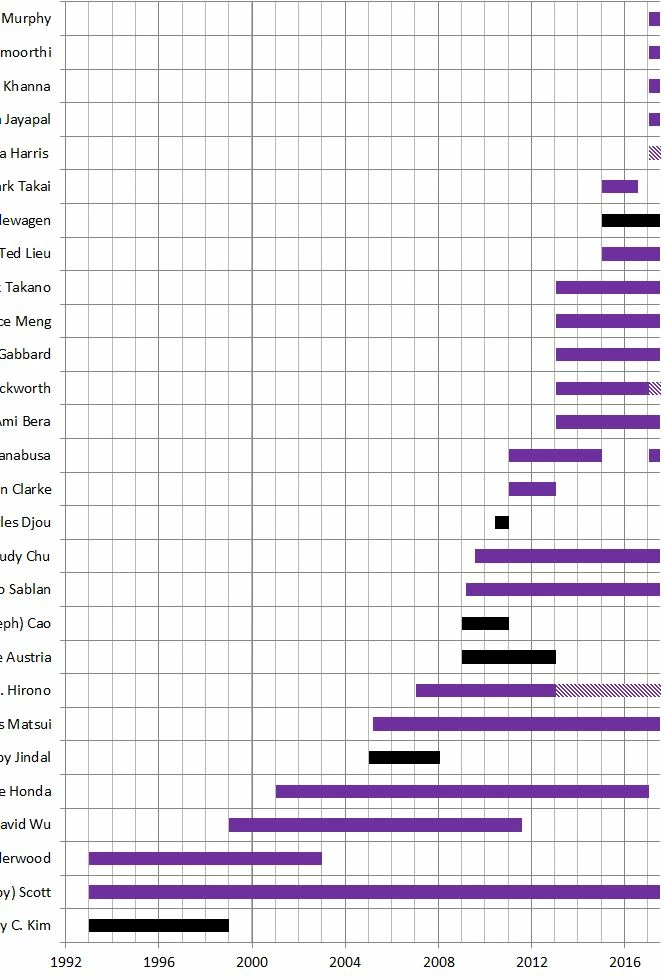
Is there a way to create a Gantt Chart in Illustrator using the charts and graphs tool? I have CC and am currently working on a project that requires a timeline of dates with names. Example: Smith was in service from Jan 1, 1993 to July 1, 2017; David was in service from Jan 3, 2011 to Jan 3 2015; etc. I can't figure out how to insert the data so it's not all starting at the same axis point like the below excel chart.