Participant
February 27, 2017
Question

Is it possible to make variable anchorpoints

  • February 27, 2017
  • 2 replies
  • 405 views

Hello,

I'm quit a newbie in Illustrator concerning "flat" anchorpoint-drawings.

I would like to have the anchorpoints (and the corresponding lines) variable. Preferable with data from Excel. I know how to make a graph with Excel-data, so I presumed I can also make a vector-drawing with the x/y-coordinates from Excel.

I calculate the x/y-coördinates in Excel and have to change them a lot, so it isn't an option to draw it over and over again. I do know there are CAD-programs, but I do not like the svg-export/import possibilities. I have to suit and configure to much.

Illustrator gives me the opportunity to combine the drawings with text, animations etc. etc.

I have searched for scripts, but I can only find examples like businesscards etc.

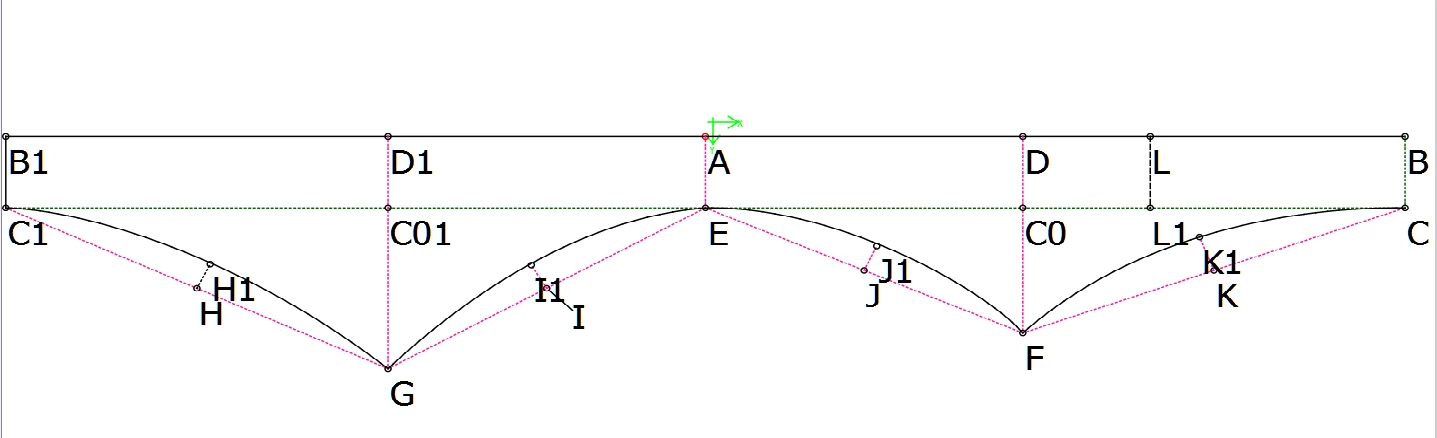
I have inserted a picture below, as an example for the drawings I want to make.

Hopefully someone can help me out????

THANKS,

Ruitertje

This topic has been closed for replies.

2 replies

Participant
February 28, 2017

Thanks voor replying and that would be GREAT!

I have posted an expected drawing at the bottom of the previous post. The letters represent the sample points.

I donot have all coördinates for the points yet.  I have drawn some extra lines for calculating with Pythagoras, but I have to calculate some points more.

I have made screenshots from Excel - sorry it's in Dutch - but in the second picture,  the green marked columns "H" and "J" gives the lines and values. The columns "A", "B" and "C" are ment for the Name, X-coördinate and Y-coördinate.

Hopefully it make some sense

Thank you!

Silly-V
Legend
March 3, 2017

I can't believe I wrote this long answer and the forums glitched and swallowed it up!

Silly-V
Legend
March 3, 2017

Okay, so your format for your spreadsheet is in this 'nordic' format - so I re-created your data and saved it as a tab-delimited text file.

Now, the cells are separated with tabs, and any cells with commas are automatically enclosed in quotes by Excel.

So here is the code:

#target illustrator

function test(){ // enclosing function wraps the body of the script

  if(app.documents.length < 1){ // this makes the script exit when there are no documents open

    return;

  }

  var f = File.openDialog("Choose a CSV file.", "*.txt"); // choose a file with a .txt extension in Windows

  if(!f){

    return; // exit script if the Cancel button was pressed

  }

  var gridStr;

  f.open('r');

  gridStr = f.read(); // read the contents of the .txt file into a string variable

  f.close();

  var grid = gridStr.split(/[\n\r]/); // turn the text into groups of rows by splitting the text by nextlines or carriage returns

  for(var i=0; i<grid.length; i++){ // go through each of the row groups and turn them into groups of cells by splitting with tab characters

   grid = grid.split(/\t/g);

  };

  var doc = app.activeDocument; // set the active document to a variable

  var ptArr = [], thisRow, x, y; // process the spreadsheet array to eliminate blank or incomplete rows

  for(var i=1; i<grid.length; i++){

    if(typeof(grid[1]) == "undefined" || typeof(grid[2]) == "undefined" || grid[1] == "" || grid[2] == ""){

      continue; // if there are blank or missing cells where the x or y points should be, ignore this row

    }

    thisRow = grid;

    x = thisRow [1].toString().replace(/"/g, '').replace(",", ".") * 1; // convert any nordic cells to numbers by removing any excel-generated quotes and replacing commas with periods, then cast to number by multiplying times one

    y = thisRow [2].toString().replace(/"/g, '').replace(",", ".") * 1;

    ptArr.push([x, y]); // add the processed coordinate point to array

  };

  var newPath = doc.pathItems.add(); // add a new path to the document

  newPath.setEntirePath(ptArr); // this command draws a polygon path by taking an array of x,y coordinate pairs: [[x,y],[x,y]]

  newPath.name = "My Test Path"; // this will make this path identified in the Layers panel so you can see which path you've just created

  newPath.filled = false;

  newPath.stroked = true; // stroke the path for visibility

};

test();

The thing is, in Illustrator the native measurement unit is a point, so if you want your path to be drawn with some kind of measurement unit, you have to find the conversion ratio of that unit to the Illustrator postscript point.

Also, to draw a path that's got curves, you'll have to do some calculations or feed data into the PathPoints of the path, specifically the leftDirection and rightDirection properties.

A pathPoint has all kinds of properties, of which the .anchor property is the xy pair of your anchor. leftDirection and rightDirection are the handles.

Here is a picture of my result:

Silly-V
Legend
February 27, 2017

Yea you can do this, with a custom script. Got any sample points and an expected result drawing?