
need help creating Graphs!
Hi All,
Here's the deal, I need to create a total of 153 graphs that will be part of an infographic for each state. There are 51 bar charts, 51 column charts, and 51 pie charts.
Here is the infographic:
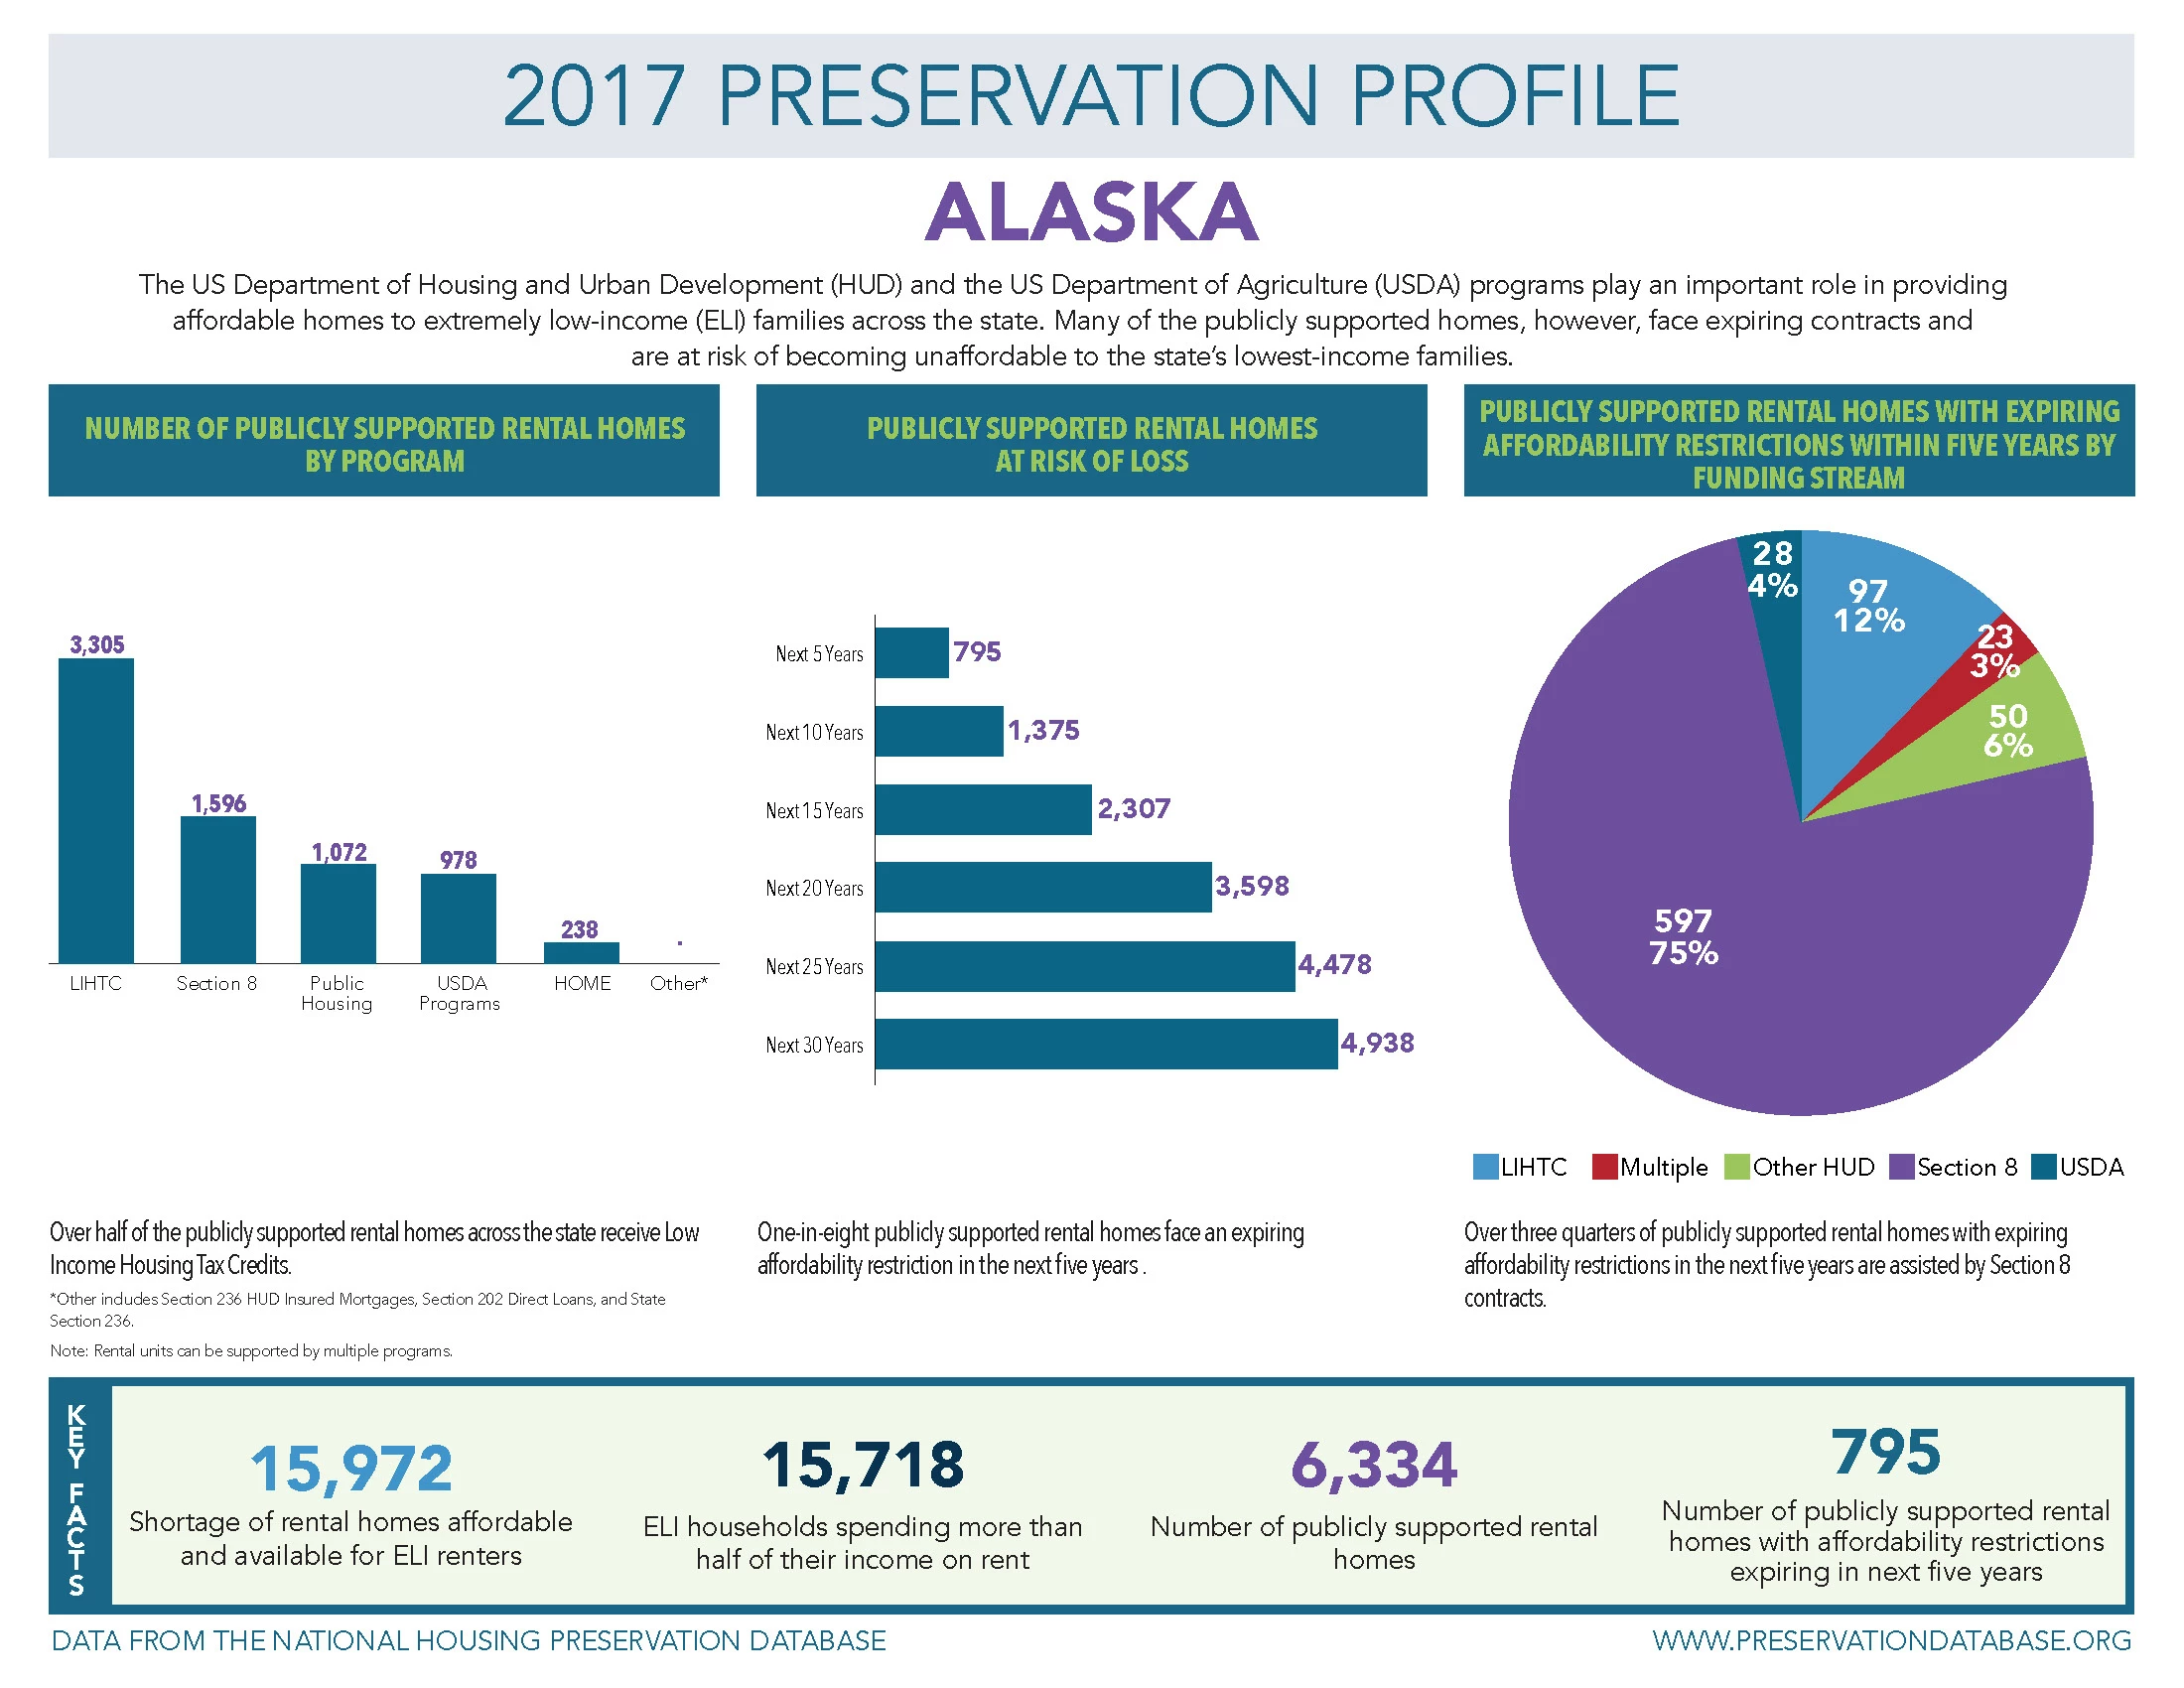
Last year, it took me 3 weeks to create each chart for each state. I had to copy the chart from Excel, Paste into Illustrator and then stylize each one and save each individual chart. Each chart is sized specifically to merge into Indesign along with the data points. It was painstaking and arduous, but I got it done.
NOW, I have to redo all the charts again, however, i don't have as much as a window to get them done. I've tried using the Illustrator Graph tool, but point plank, IT'S HORRIBLE. For instance, on this chart below, I cannot remove the value axis, and for some reason I cannot add the value labels above the chart:
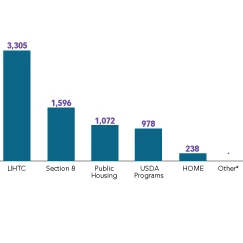
The other issue is that I received the Excel Table and each chart is a Pivot Chart, so when I try and do it old-school, it pastes in a format that I can't edit it. What I am looking for is something EASY and SEAMLESS that will work with Illustrator.
Are there any Plug-Ins that anyone knows of that can do this? What about any Excel Extensions. Any online tools out there for charts? I'm at a loss here and I don't have 3 weeks to get these done.
Please help!!!!