
Participant
Jan 23, 2024 10:13 AM UTC
Answered

Scatter Plot Graph Help

I'm trying to create a Scatter-Plot Graph, and I'm having a devil of a time.

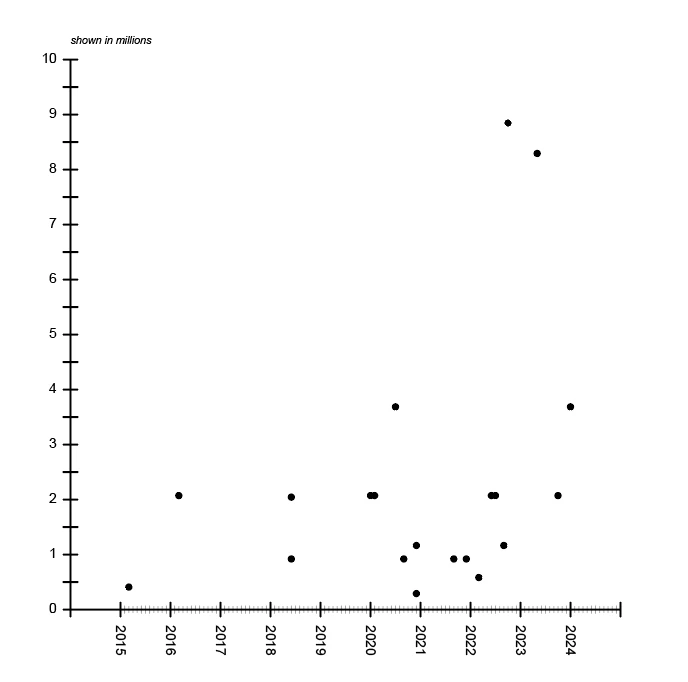
I need to plot data over time (X-axis). Some of the data-points overlap (are on the same date), but have different values (Y-axis). I absolutely cannot for the life of me, figure out how to use the Scatter-Plot tool, and the documentation is slim to almost non-existent.

I've created one Scatter-Plot Graph the old fashioned way: I just drew it.
The comma-delineated data is shown below the image:
3/2015, 407040
3/2016, 2073600
6/2018, 921600
6/2018, 2073600
1/2020, 2073600
2/2020, 2073600
7/2020, 3686400
9/2020, 921600
12/2020, 1166400
12/2020, 291600
9/2021, 921600
12/2021, 921600
3/2022, 583200
6/2022, 2073600
7/2022, 2073600
9/2022, 1166400
10/2022, 8847360
5/2023, 8294400
10/2023, 2073600
1/2024, 3686400

I need to make dozens of these. I cannot draw each one this way. Any assistance on how to create this kind of graph using the graph tool is appreciated, thank you.

This topic is closed to new replies. Start a new post to keep the conversation going.
adamfp
adamfpCorrect answer
Inspiring
Jul 4, 2024 12:31 AM UTC

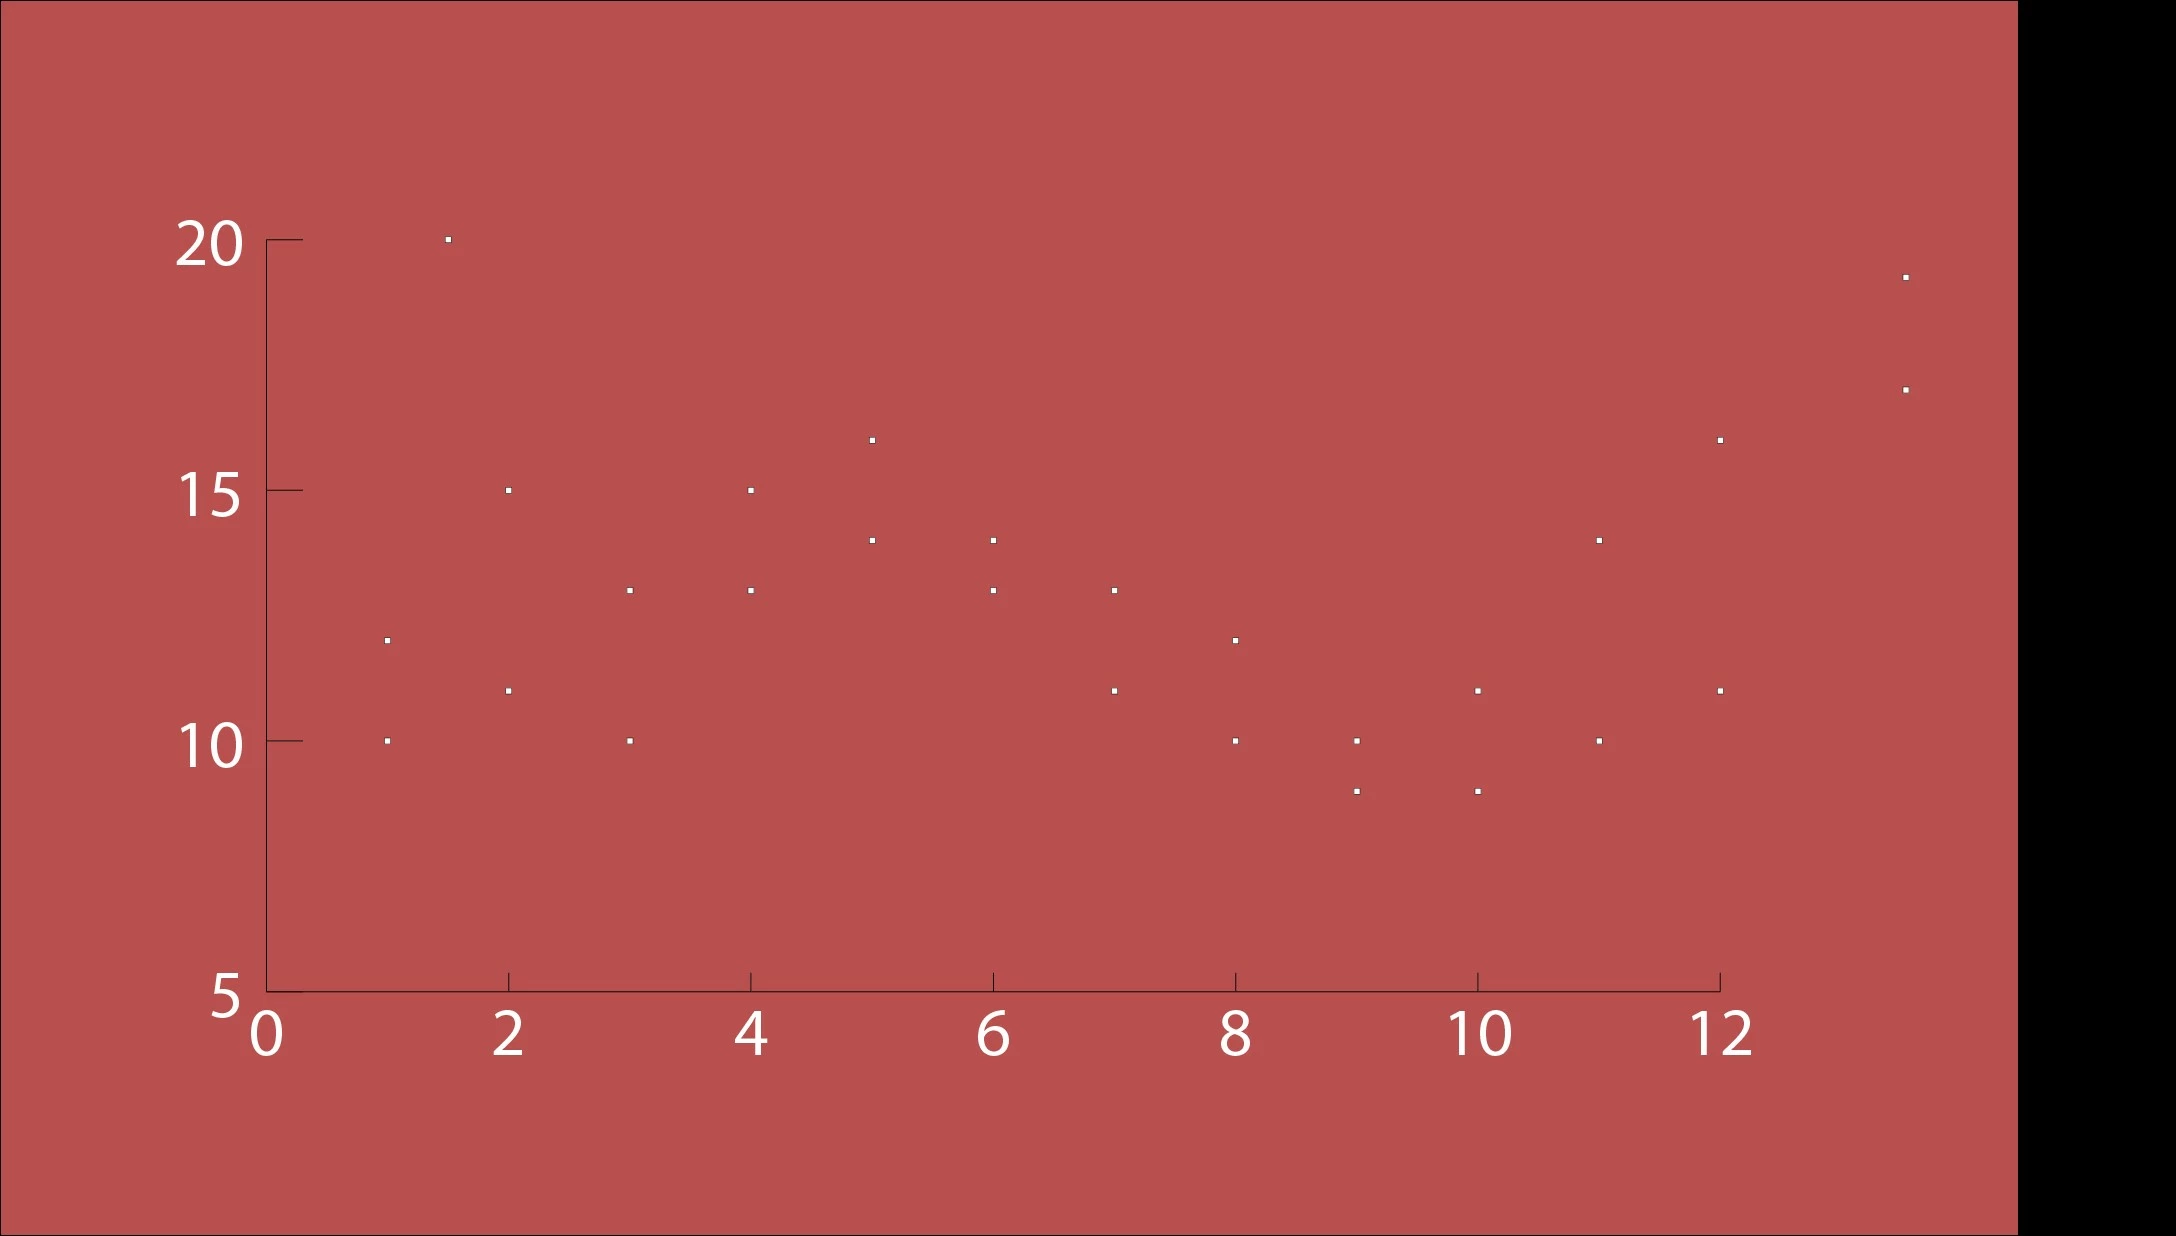
I followed instructions on this Adobe help page  to make a scatter plot graph and it looks more like your example than Monika's. The page has specific instructions for scatter graphs.


4 replies

adamfp
adamfpCorrect answer
Inspiring
Jul 4, 2024 12:31 AM UTC

I followed instructions on this Adobe help page  to make a scatter plot graph and it looks more like your example than Monika's. The page has specific instructions for scatter graphs.


Translate
Monika Gause
Community Expert
Community Expert
Jul 4, 2024 7:44 AM UTC

@adamfp  schrieb:

I followed instructions on this Adobe help page  to make a scatter plot graph and it looks more like your example than Monika's. The page has specific instructions for scatter graphs.


Yes, it has instructions on how to turn off the connecting lines. And then my example will look like what everyone seems to expect.

Translate
Monika Gause
Community Expert
Community Expert
Jan 23, 2024 11:13 AM UTC

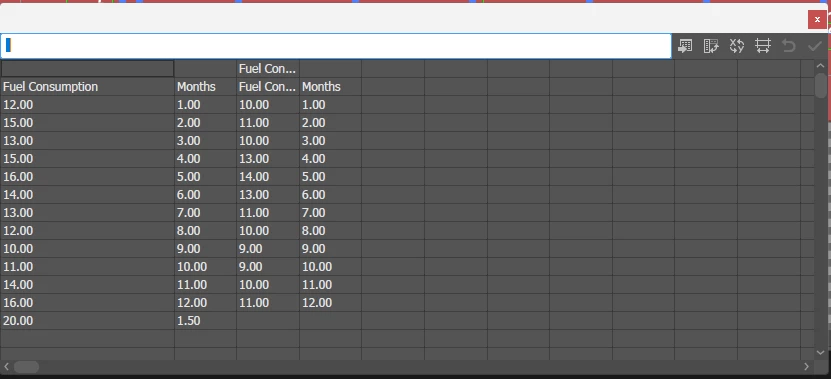
Scatter plot is meant for this type of graph:

Data for this graph has to be entered like this:

Translate
Participant
Jan 23, 2024 8:06 PM UTC

Not according to everyone else on the planet, including Google:

https://www.google.com/search?&q=scatter+plot+graph&tbm=isch
Or Wikipedia:

https://en.wikipedia.org/wiki/Scatter_plot

Or literally anyone covering Scatter Plots:
https://chartio.com/learn/charts/what-is-a-scatter-plot/#visualization-tools


So Adobe has mislabeled a tool, that cannot do what it says?

Translate