Answered
Trying to make line graph, but problems with overlapping text on x-axis
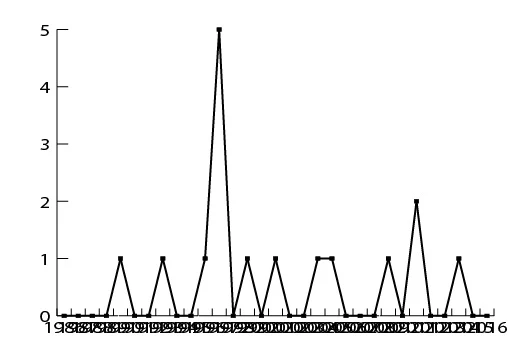
I am trying to create a line graph from 30 years' worth of data, with the years listed on the x-axis and the number of individuals on the y-axis. When I do this in Excel, the program automatically adjusts the years on the x-axis (in this case, only writing out every other year) and orients the text vertically for easier reading. I was trying to reproduce this graph in Illustrator for publication, but when I enter the data, every single year is written out along the x-axis and they are all overlapping each other, which makes them impossible to read. How can I fix this?