Hey Evgenii
Inspiring
April 11, 2025
Question

vs code extendscript debugger

  • April 11, 2025
  • 1 reply
  • 310 views

Is it possible to remove old host apps from attach windows? 

1 reply

m1b
Community Expert
Community Expert
April 11, 2025

Hi @Hey Evgenii I don't have a direct answer, but would it suit your situation to use a launch.json file?


This specifies the host app as well as some ExtendScript Debugger settings. I use this approach for all my script development. This is my launch.json for my general Illustrator scripting folder:

{
    "version": "0.2.0",
    "configurations": [
        {
            "type": "extendscript-debug",
            "request": "attach",
            "name": "Attach--transient",
            "hostAppSpecifier": "illustrator-29.064",
            "engineName": "transient",
            "hiddenTypes": [
                "builtin",
            ],
        },
    ]
}

 (The "hiddenTypes" "builtin" configures the debugger to hide some properties, making it much cleaner to examine.)


Also if it helps, these are the keybindings I've set up for the debugger:

{
    "key": "alt+cmd+.",
    "command": "workbench.debug.panel.action.clearReplAction"
},
{
    "key": "ctrl+alt+cmd+a",
    "command": "workbench.action.debug.stop",
    "when": "inDebugMode"
},
{
    "key": "ctrl+alt+cmd+a",
    "command": "workbench.action.debug.run",
    "when": "debuggersAvailable && debugState == 'inactive'"
},
{
    "key": "cmd+r",
    "command": "extension.extendscript-debug.evalInAttachedHost",
    "args": {
        "debugLevel": 1,
        "bringToFront": false
    }
},
{
    "key": "cmd+shift+r",
    "command": "extension.extendscript-debug.evalInAttachedHost",
    "args": {
        "debugLevel": 1,
        "bringToFront": true
    }
},
{
    "key": "cmd+.",
    "command": "extension.extendscript-debug.haltInHost",
    "when": "inDebugMode"
},
{
    "key": "ctrl+.",
    "command": "workbench.action.debug.stop",
    "when": "inDebugMode"
},
{
    "key": "ctrl+m",
    "command": "workbench.action.debug.stepInto",
    "when": "debugState != 'inactive'"
},
{
    "key": "ctrl+i",
    "command": "workbench.action.debug.stepOut",
    "when": "debugState == 'stopped'"
},
{
    "key": "ctrl+l",
    "command": "workbench.action.debug.stepOver",
    "when": "debugState == 'stopped'"
},
{
    "key": "ctrl+shift+l",
    "command": "workbench.action.debug.continue",
    "when": "debugState == 'stopped'"
},
{
    "key": "ctrl+shift+c",
    "command": "editor.debug.action.runToCursor",
    "when": "debugState == 'stopped'"
},

(These are stored in keybinding.json. Note that I'm on MacOS so you see "cmd" etc.)


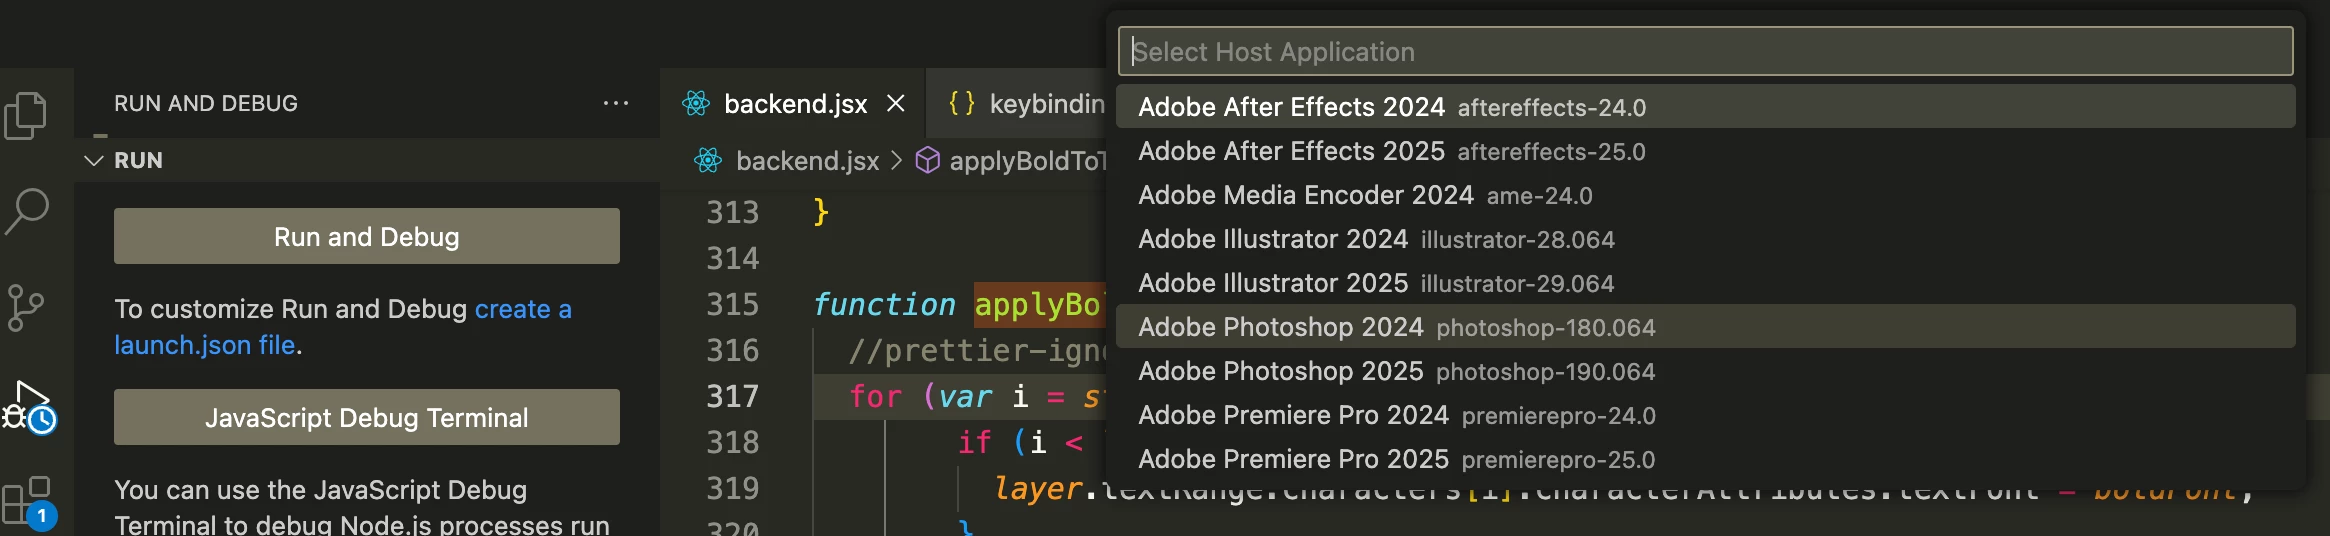
So with launch.json and those keybindings, I can "attach" the debugger (once) and then just run script after script. I never see the menu that you show in your post.

- Mark