That's OK. I've got the gist of your situation. But I don't know if I have a solution for you.
I've had experiences like this before, but to the opposite result. Acrobat used to have "font hinting " that would artificially thicken narrow text strokes and thicken fine lines on lower-resolution output devices like desktop inkjet and laser printers. And long ago, back in the days of Adobe PageMaker, there was the dreaded "hairline" stroke setting where you'd get a roughly quarter-point line on your laser printer, but when you ran film on a high-resolution 2400dpi imagesetter that stroke would be come 1/2400th of an inch thick — essentially invisible on press. But I've not run across a situation like yours, where Acrobat thinned a drawn line that was drawn thicker than it appears on the PDF.
But I may have a way to maybe get you a thicker result.
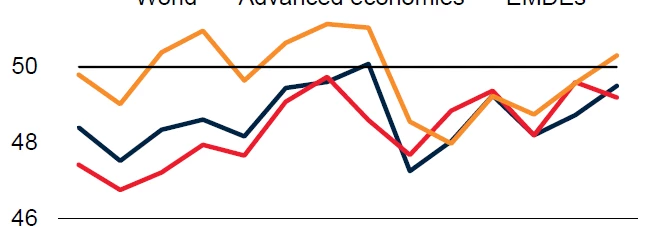
- Copy the graphs.
- Open Adobe Illustrator. Create a new file.
- Paste the graph in Adobe Illustrator. Make sure it's showing the stroke width you want for your final result. Save it as an AI-native .ai file, then as an Illustrator PDF .pdf file.
- Open a new InDesign document file.
- Place first the .ai file, then the .pdf file in the new InDesign document file.
- Print it from InDesign, then create a PDF file from InDesign and see if you get different results.
I'm hopeful that if you turn the InDesign-created graphics into Illustrator formatted files and place them into your InDesign document, you'll get the results you're looking for. I've had to do this before with problematic graphics I created within InDesign, and got good results. I'm hopeful you will too. All it can do is work, right?
Give this a try, and let me know how this works out for you. If it doesn't, there are tricks we can apply within Adobe Illustrator to fiddle with things until they work the way you want. But let's try the easy way first.
Hope this helps,
Randy
But you helped, Randy. It looks like the issue is the EMF. I should place the charts as PSD. Thank you, all!