


Copy link to clipboard
Copied
Hi,
I am trying to create the histogram of a image and created it. But the histogram is not completely matching with histogram in Photoshop. Can anyone help me out where i have made the mistake.
i am attaching the image from the library. Please find my sample code below and let me know your thoughts.
var rholder:Sprite = new Sprite();
var gholder:Sprite = new Sprite();
var bholder:Sprite = new Sprite();
var r_arr:Array = new Array();
var g_arr:Array = new Array();
var b_arr:Array = new Array();
var i:int = 0;
var j:int = 0;
addChild(rholder);
addChild(gholder);
addChild(bholder);
rholder.blendMode = BlendMode.SCREEN;
gholder.blendMode = BlendMode.SCREEN;
bholder.blendMode = BlendMode.SCREEN;
rholder.x = 100;
gholder.x = 100;
bholder.x = 100;
rholder.y = 400;
gholder.y = 400;
bholder.y = 400;
//zero out the data
for (i; i <= 255; i++)
{
r_arr = 0;
g_arr = 0;
b_arr = 0;
}
i = 0;
var _mc:Image = new Image();
var bmd:BitmapData = new BitmapData(_mc.width,_mc.height,true);
//Get the Data from the image
bmd.draw(_mc);
var total = bmd.width * bmd.height;
for (i; i < bmd.width; i++)
{
for (j; j < bmd.height; j++)
{
var color:uint = bmd.getPixel(i,j);
var r:uint = color >> 16;
var g:uint = color >> 8 & 0xFF;
var b:uint = color & 0xFF;
r_arr
g_arr
b_arr
}
j = 0;
}
//Draw out Histograms
for (i = 0; i <= 255; i++)
{
var rline:Shape = new Shape();
rholder.addChild(rline);
rline.x = i;
rline.graphics.lineStyle(.25, 0xff0000);
rline.graphics.lineTo(0, -(r_arr / 100));
var gline:Shape = new Shape();
gholder.addChild(gline);
gline.x = i;
gline.graphics.lineStyle(.25, 0x00ff00);
gline.graphics.lineTo(0, -(g_arr / 100));
var bline:Shape = new Shape();
bholder.addChild(bline);
bline.x = i;
bline.graphics.lineStyle(.25, 0x0000ff);
bline.graphics.lineTo(0, -(b_arr / 100));
}
Regards,
Kameshwaran A.


 1 Correct answer

they look the about same to me except your x-scale is compressed (or the y-scale is expanded) in the flash screenshot.
anyway, i think a more useful graphing of the color distribution of an image would the following. if you want to visualize the gray scale distribution you look for the gray region where all three colors overlap in the following. i included a yscale paramenter that you probably want to increase so it looks exactly like the ps gray scale histogram. using a white background for t
... 7
Replies
7
7
Replies
7
Copy link to clipboard
Copied
comment out your blendmode statements and retest.
Copy link to clipboard
Copied
I have comment it and checked. only difference i found was color. Please find the below histogram for the same image after commenting blend mode.

Copy link to clipboard
Copied
then what's the problem?
Copy link to clipboard
Copied
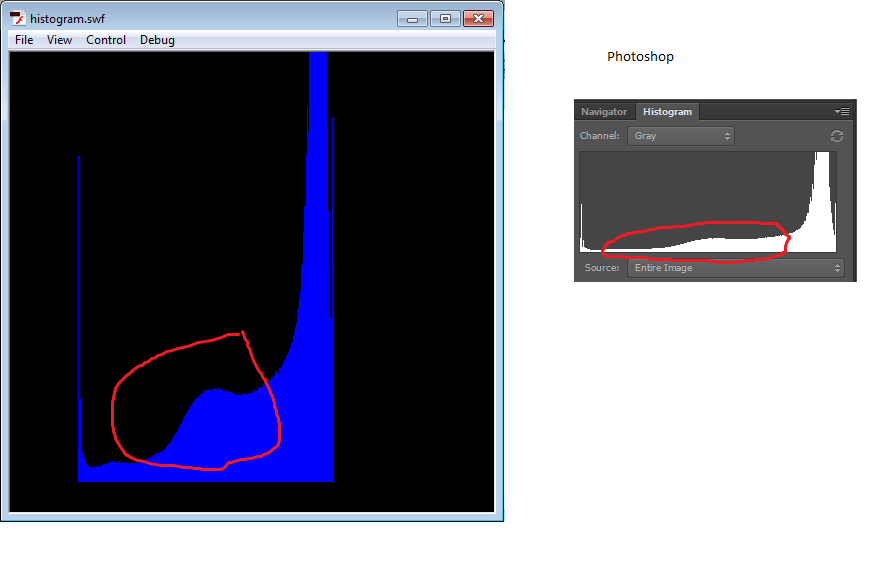
Both(Flash and Photoshop) doesn't look like same. Kindly see the marked place. I want it to be same.
Copy link to clipboard
Copied
they look the about same to me except your x-scale is compressed (or the y-scale is expanded) in the flash screenshot.
anyway, i think a more useful graphing of the color distribution of an image would the following. if you want to visualize the gray scale distribution you look for the gray region where all three colors overlap in the following. i included a yscale paramenter that you probably want to increase so it looks exactly like the ps gray scale histogram. using a white background for the histogram would be a good idea, too.
var histogram_parent:Sprite = new Sprite();
var r_arr:Array = new Array();
var g_arr:Array = new Array();
var b_arr:Array = new Array();
var line:Shape;
var yscale:int = 100;
var color:uint;
var r:uint;
var g:uint;
var b:uint
var i:int;
var j:int;
histogram_parent.y = stage.stageHeight;
addChild(histogram_parent);
for (i=0; i <= 255; i++){
r_arr = 0;
g_arr = 0;
b_arr = 0;
}
var _mc:Image = new Image();
var bmd:BitmapData = new BitmapData(_mc.width,_mc.height,true);
//Get the Data from the image
bmd.draw(_mc);
var total = bmd.width * bmd.height;
for (i=0; i < bmd.width; i++){
for (j=0; j < bmd.height; j++) {
color = bmd.getPixel(i,j);
r = color >> 16;
g = color >> 8 & 0xFF;
b = color & 0xFF;
r_arr
g_arr
b_arr ++;
}
}
//Draw out Histograms
for (i = 0; i <= 255; i++){
line = new Shape();
histogram_parent.addChild(line);
line.x = i;
line.graphics.lineStyle(.25, 0xff0000,.5);
line.graphics.lineTo(0, -(r_arr / yscale));
line = new Shape();
histogram_parent.addChild(line);
line.x = i;
line.graphics.lineStyle(.25, 0x00ff00,.5);
line.graphics.lineTo(0, -(g_arr / yscale));
line = new Shape();
histogram_parent.addChild(line);
line.x = i;
line.graphics.lineStyle(.25, 0x0000ff,.5);
line.graphics.lineTo(0, -(b_arr / yscale));
}
Copy link to clipboard
Copied
Thanks for the suggestion and it works good for me. Could you please suggest me on which -basis PS is calculating the x-scale or y-scale.
Copy link to clipboard
Copied
i'm not a ps expert.
you could post to the ps forum to see what they say.

Get ready! An upgraded Adobe Community experience is coming in January.
Learn more
 AdChoices