

- Home
- Audition
- Discussions
- Re: Frequency Analysis Window--Two Tracks Simultan...
- Re: Frequency Analysis Window--Two Tracks Simultan...

Copy link to clipboard
Copied
Can someone please point me to a tutorial, or guide me through the steps for how to select two separate tracks (or mono files) and display their frequency analysis simultaneously so that I can compare them?
Thanks very much.


 1 Correct answer

This is relatively easy to do. Open the files you want to compare and open the frequency analysis window. Highlight the selection you want to analyse, and hit the 'Scan Selection' button below the display. At the top of the display you will find a series of coloured buttons with the word 'hold' next to the numbers above them - as shown below:
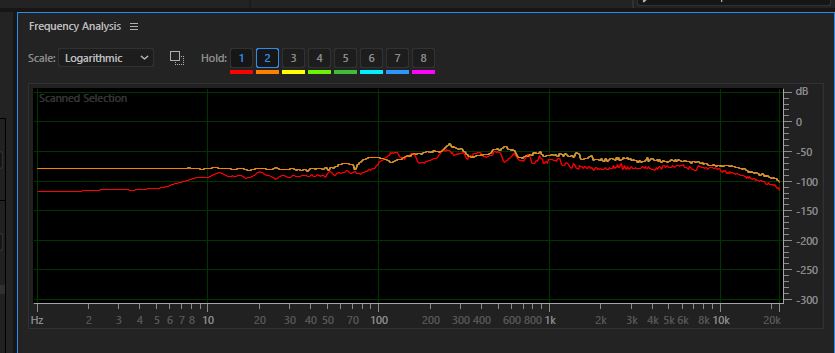
When you have your display scanned, then hit the 'hold' button above the red button (or indeed any of them; it doesn't matter which) and the line you are di
... 4
Replies
4
4
Replies
4
Copy link to clipboard
Copied
This is relatively easy to do. Open the files you want to compare and open the frequency analysis window. Highlight the selection you want to analyse, and hit the 'Scan Selection' button below the display. At the top of the display you will find a series of coloured buttons with the word 'hold' next to the numbers above them - as shown below:
When you have your display scanned, then hit the 'hold' button above the red button (or indeed any of them; it doesn't matter which) and the line you are displaying will be frozen in the display in the colour of the button you chose. Now open the other file, and repeat the procedure, selecting a different colour. You will then have the frequency response of both tracks displayed simultaneously. And you can repeat this for up to eight tracks.
If you right-click on the display when you've finished, you can export all the data you've frozen into CSV file that you can open in a spreadsheet if you so desire.
HTH.
Copy link to clipboard
Copied
Thank you Steve--very clear, and it seems to have worked the first time. (I THINK the frequency spectrum of the two files is exactly the same, so one overlaps the other exactly, so I'm not completely sure.) One related question: Can I adjust the range of the axes on the frequency analysis display?

Copy link to clipboard
Copied
To Zoom on the Frequency axis right click to show the Zoom menu or right click, hold and move the cursor to select the area you want to zoom into. And do the same to zoom on the Level axis.
Copy link to clipboard
Copied
Great! Thanks.
Get ready! An upgraded Adobe Community experience is coming in January.
Learn more
 AdChoices