
Learn Series Part 6: When and how to use Spectral Frequency Display

This is a part of the ongoing Learn series with Mike Russell which will help you get started with Adobe Audition. We've some interesting articles & videos coming up weekly where we will talk about the tools, workflow & some really cool effects. Let us know how you use Audition & what you want to learn about Adobe Audition. We're here to help.


In this video, you will understand the difference between the Waveform Display and the Spectral Frequency Display and when to use one over the other.
0:34 - How to enable spectral frequency display
0:46 - What is spectral frequency display used for?
1:13 - Checking frequencies like sibilance
1:26 - Isolating individual audio frequencies
1:36 - Analysing sibilance
1:45 - Using the Frequency Analysis window
2:03 - Isolating speech using spectral frequency view
2:52 - Noise reduction using spectral frequency
3:22 - Removing mouth clicks in spectral frequency
3:50 - Using the spot healing brush tool
4:31 - Recap on the uses for spectral frequency display
Waveform Display
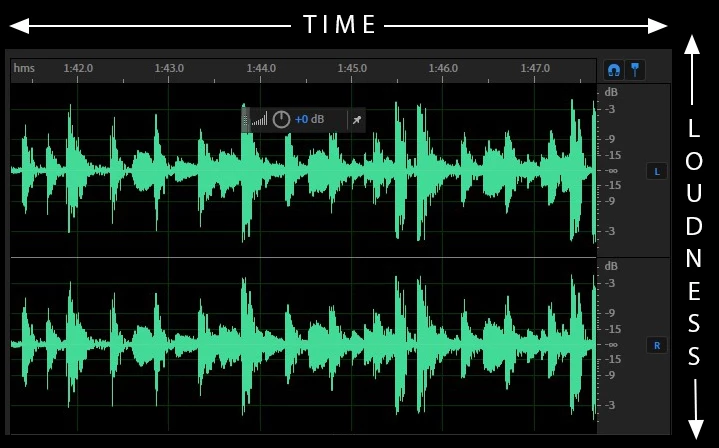
Waveform Display shows the variation of Amplitude or the loudness (on Y-axis) of the signal with respect to time (on X-axis). It is useful for analyzing the overall loudness and sections of silence In the audio. It is also good for identifying percussive changes in vocals, drums, and more. To find a particular spoken word, for example, simply look for the peak at the first syllable and the valley after the last. Learn more about the Waveform Display.
Spectral Frequency Display
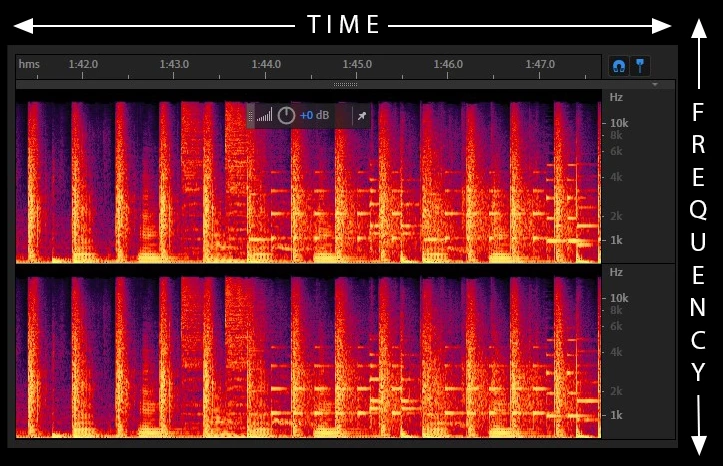
Spectral Frequency Display shows the variation of Frequency (on Y-axis) with respect to time (on X-axis). As it shows the variation of different frequency components (which is not available in Waveform Display), it is useful for identifying problems within a frequency range such as unwanted noise (beeps, hisses, and other artifacts). The amplitude or loudness of each frequency range is shown in different colors. Brighter colors represent greater amplitude components. Colors range from dark blue (low‑amplitude frequencies) to bright yellow (high‑amplitude frequencies).
Here you can visually draw a selection over the desired frequency components and remove it or make it more pronounced. Read this blog to know more about this visual editing in Spectral Frequency Display
Learn more about the Spectral Frequency Display
Learn how to clean up audio using Spectral Frequency Display
Hope you find it useful. Refer to this page to explore the other videos of this series. Let us know if you have any questions.
