


Copy link to clipboard
Copied
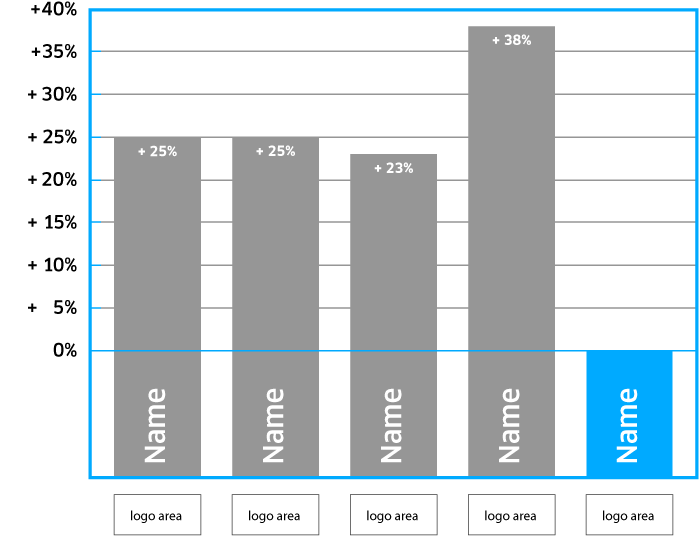
Hi there, I hope I post my question in the right forum. I'm looking for a solution to have a simple bar graph that can be monthly updated by some data file. The graph consists of 4-5 bars that display a single value. What varies is - of course - the bars length, name inside the bar and the value in numbers within the bar. Underneath each bar comes a logo which has to be changed every now and then. See my example underneath.
At the moment the graphs are static in an e-pub document (Indesign CC17) and are manually updated each month. After mutations, the e-pub is exported as html pages using IN5. What would be the best solution/workflow for this setup? Thanks in advance!


 1 Correct answer

 16
Replies
16
16
Replies
16

Copy link to clipboard
Copied
I am uncertain if you want to do this in inDesign, or use html/css in Dreamweaver to do this.
If this is an inDesign question please let me know, and i will move your question to the inDesign forum, if you do wish to do this in Dreamweaver, then a number of methods are described, with example code at -
Copy link to clipboard
Copied
Thank you pziecina. I just described the workflow of the project at hand. Chances are very slight that this problem can be solved (partially) through Indesign. So you can leave this thread here. But I'll post this question over there as well. And I'm not much of a coder either hence the use of IN5. So the solution I'm after should be easy and straightforward. I've shown what kind of graphs I need and which are the main variables. The monthly changes would be the percentages. Things like change of logo would probably be annually.

Copy link to clipboard
Copied
Here's another, along the same lines as Nancy posted:
Copy link to clipboard
Copied
Nice. But I thought you hated animation  .
.
Copy link to clipboard
Copied
https://forums.adobe.com/people/Nancy+OShea wrote
Nice. But I thought you hated animation .
For the purpose of a bars charts, etc it seems a good idea. If its just to twirl around a few icons it has no relevance. So I dont actually hate annimation I hate developers who use it where it adds no real value.
Copy link to clipboard
Copied
Thanks everyone! I'm exploring your suggestions. I was hoping for a svg option.
Copy link to clipboard
Copied
Try this:
How to Make Charts with SVG | CSS-Tricks
Copy link to clipboard
Copied
Thanks Nancy, I came across that one as well. From what I've gathered svg is not very well documented. Can you point me to some training material, a book or anything? Svg could be very cool for a lot of other applications as well.
Copy link to clipboard
Copied
I like SVG for some things. But manually coding bar graphs in SVG would be a pain.
https://bost.ocks.org/mike/bar/2/

Copy link to clipboard
Copied
W3Schools has some decent info on SVG: SVG Tutorial
I don't pretend to know everything about it, but that site helped me get my head around a few of the more common concepts when I was researching it for a project anyway.
Copy link to clipboard
Copied
Thanks eveyone. Coming from the print side I would recon you set things up in AI, give it some properties, export it and take it from there. I thought that was one of the strengths of svg but I could be totally wrong.
Copy link to clipboard
Copied
motiondude wrote
Thanks eveyone. Coming from the print side I would recon you set things up in AI, give it some properties, export it and take it from there. I thought that was one of the strengths of svg but I could be totally wrong.
The problem is that creating svg's in illustrator does not work like that, and for a none coder all you would be doing is replacing a static png/jpeg image with a static svg 'image'. To get any dynamic content into an svg created in illustrator you would have to add javascript code at creation time in illustrator.
These days there are a number of ways to create dynamic svg's, either by adding javascript or by using css transforms, transitions or animations, with the simplest being the css route, which illustrator does not support.
Then there is the problem that you have previously said you are not a coder, effectively ruling out all the possibilities i mentioned. A number of users have been asking for better support by Adobe for svg and its animation methods, but currently there has been no indication by them that this is even under consideration.
Copy link to clipboard
Copied
I don't even think Animate CC supports animated SVG. I'm pretty sure it exports SVGs as static vectors which is kind of useless if you ask me.
I'm waiting for a really great animated SVG generator with an easy to understand graphical UI. I've looked at vivus, snap & circus but they fall way short of what I'm dreaming about.
Nancy
Copy link to clipboard
Copied
You have started me off Nancy, so if anyone complains about me ranting I am going to blame you .
You are correct in that Animate does not support the creation of animated svg's. What annoys me though is that Dw itself has one of the best svg code editors available, but mixing javascript or css with svg is more trouble than it is worth, (code hinting is terrible when one tries). The other problem with Dw is that one cannot draw svg's when using Dw, it is a code or nothing environment.
Illustrator on the other hand is fantastic for drawing svg's, but the javascript must be added at creation time as once the svg is saved the svg code becomes almost unreadable in Dw, and it does not support adding css. These limitations of no css, having to add the js in illustrator and code that is difficult to change in Dw, makes it unusable for most users for anything beyond static svg 'images' being created in illustrator.
svg was created by Adobe in answer to the problems/limitations of vml from microsoft, but the usual problems of having to use two different types of code, and browser compatability meant that both were never popular. Now though all modern browsers and devices support svg, and vml has been dropped by Microsoft.
What we really require is some way to discuss what those developing web sites/apps, and the content, to 'talk' with those at Adobe who can make the decisions regarding future improvements across multiple products. As relying or thinking that the current CAB/pre-release (or even user forums) method for each individual product, simply does not work when something would be best supported using more than one product.
The problem with the above though, (trying not to sound like a certain shopping web site ex-user) is that those chosen would almost certainly have no idea what they were talking about when it came to the features required across each individual product, and would almost certainly not represent what is required in the future, (most cannot get the html/css/javascript requirerments correct in one product) making anything Adobe would do, out-dated before it was included.
Copy link to clipboard
Copied
Thanks every one. You can rant whatever you want. AI is the least developed app of the whole suite for years. The promise of more frequent updates and/or functionalities in the CC model turned out to be an empty one. As for my situation, the graph doesn't need to be animated, it only needs to be easily updated by a xml-like document. That's all. I wanted to find out here what my options were and every now and then people are enthusiast about svg. I like the crispiness of the small sized typography. I've outsourced the project but I do like to in situations what's best and the way to do it. So thanks.
Copy link to clipboard
Copied
You could do this very quickly with HTML5 + Canvas.js. Simply change values in the dataPoints array shown below in red. Canvas.js is quite flexible and there's good documentation for it on their website.
Paste this code into a new, blank document.
<!DOCTYPE HTML>
<html lang="en">
<head>
<script type="text/javascript">
window.onload = function () {
var chart = new CanvasJS.Chart("chartContainer", {
title:{
text: "Fruits sold in First Quarter"
},
data: [//array of dataSeries
{ //dataSeries object
/*** Change type "column" to "bar", "area", "line" or "pie"***/
type: "column",
dataPoints: [
{ label: "banana", y: 24 },
{ label: "orange", y: 29 },
{ label: "apple", y: 40 },
{ label: "mango", y: 34 },
{ label: "grape", y: 24 }
]
}
]
});
chart.render();
}
</script>
<script type="text/javascript" src="https://canvasjs.com/assets/script/canvasjs.min.js"></script>
</head>
<body>
<div id="chartContainer" style="height: 300px; width: 100%;"> </div>
</body>
</html>

Get ready! An upgraded Adobe Community experience is coming in January.
Learn more
 AdChoices