Inspiring
September 19, 2017
Answered

Dynamic bar graph

  • September 19, 2017
  • 2 replies
  • 4575 views

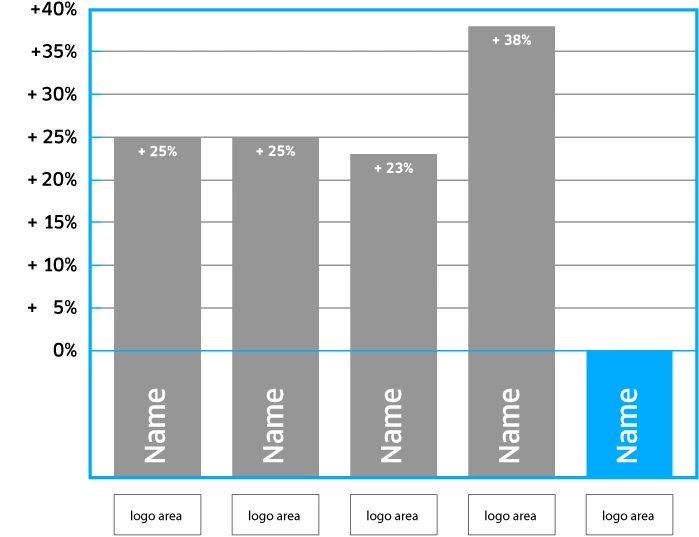
Hi there, I hope I post my question in the right forum. I'm looking for a solution to have a simple bar graph that can be monthly updated by some data file. The graph consists of 4-5 bars that display a single value. What varies is - of course - the bars length, name inside the bar and the value in numbers within the bar. Underneath each bar comes a logo which has to be changed every now and then. See my example underneath.

At the moment the graphs are static in an e-pub document (Indesign CC17) and are manually updated each month. After mutations, the e-pub is exported as html pages using IN5. What would be the best solution/workflow for this setup? Thanks in advance!

    This topic has been closed for replies.
    Correct answer Nancy OShea

    Thanks everyone! I'm exploring your suggestions. I was hoping for a svg option.


    Try this:

    How to Make Charts with SVG | CSS-Tricks

    2 replies

    Nancy OShea
    Community Expert
    Community Expert
    September 19, 2017

    You could do this very quickly with HTML5 + Canvas.js.  Simply change values in the dataPoints array shown below in red.  Canvas.js is quite flexible and there's good documentation for it on their website.

    Paste this code into a new, blank document.

    <!DOCTYPE HTML>

    <html lang="en">

    <head>

    <script type="text/javascript">

      window.onload = function () {

        var chart = new CanvasJS.Chart("chartContainer", {

          title:{

            text: "Fruits sold in First Quarter"            

          },

          data: [//array of dataSeries            

            { //dataSeries object

            /*** Change type "column" to "bar", "area", "line" or "pie"***/

            type: "column",

            dataPoints: [

            { label: "banana", y: 24 },

            { label: "orange", y: 29 },

            { label: "apple", y: 40 },

            { label: "mango", y: 34 },

            { label: "grape", y: 24 }

            ]

          }

          ]

        });

        chart.render();

      }

      </script>

    <script type="text/javascript" src="https://canvasjs.com/assets/script/canvasjs.min.js"></script>

    </head>

    <body>

    <div id="chartContainer" style="height: 300px; width: 100%;"> </div>

    </body>

    </html>

    Nancy O'Shea— Product User & Community Expert
    pziecina
    Legend
    September 19, 2017

    I am uncertain if you want to do this in inDesign, or use html/css in Dreamweaver to do this.

    If this is an inDesign question please let me know, and i will move your question to the inDesign forum, if you do wish to do this in Dreamweaver, then a number of methods are described, with example code at -

    https://css-tricks.com/making-charts-with-css/

    Inspiring
    September 19, 2017

    Thank you pziecina. I just described the workflow of the project at hand. Chances are very slight that this problem can be solved (partially) through Indesign. So you can leave this thread here. But I'll post this question over there as well. And I'm not much of a coder either hence the use of IN5. So the solution I'm after should be easy and straightforward. I've shown what kind of graphs I need and which are the main variables. The monthly changes would be the percentages. Things like change of logo would probably be annually.

    Legend
    September 19, 2017

    Here's another, along the same lines as Nancy posted:

    Chart.js | Open source HTML5 Charts for your website