Copy link to clipboard
Copied
Hello,
I work since a long time with Adobe CEP extension.
But since few days, when I start my extension, I have a white page on my Chrome debug. I enter the adresse for the debug : http://localhost:8089. Chrome display the link for debug my extension but when I click on it, I arrive on a white page.
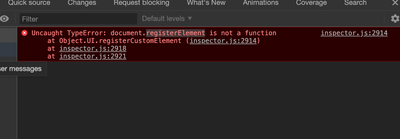
The body tag is empty and in the console I've got this message :
Uncaught TypeError: document.registerElement is not a function
at Object.UI.registerCustomElement (inspector.js:2964)
Very strange !!!
Impossible to access debug. I try in Firefox, same thing.
I restart my computer many times, I verify manifest.xml and .debug file. Everything is OK !
Someone have an idea, a solution ?
Thanks
 2 Correct answers
apparently google Chrome. ver 8.0.0.3987.87 not compatible extension debuger
in my case I downloaded old ver Chrome and it works
old chrome download here
Try cefclient. You can download below.
https://github.com/Adobe-CEP/CEP-Resources/tree/master/CEP_9.x
Copy link to clipboard
Copied
apparently google Chrome. ver 8.0.0.3987.87 not compatible extension debuger
in my case I downloaded old ver Chrome and it works
old chrome download here
Copy link to clipboard
Copied
I had the same issue and downgrading Chrome fixed it for me as well!
Thank you, Kawano Shuji!
-Don
Copy link to clipboard
Copied
Hello, downgrading Chrome fixed the problem.
CefClient fix the problem too.
I keep the 2 solutions !
Thanks Kawano.
Thanks Ten
Copy link to clipboard
Copied
Im not sure this is related to Chrome actually. Im doing some work on a CEP7 plugin and i see it in both Chrome and Safari. As i read this thread, i thought let me check Safari to confirm it is a Chrome issue. Prhaps they both use same script somehow?! I don't know enough about devtools to safari's devtool to say that is possible.
I think its a script issue, but were does this script "inspector.js" come from. Anyone got an idea?


Copy link to clipboard
Copied
Try cefclient. You can download below.
https://github.com/Adobe-CEP/CEP-Resources/tree/master/CEP_9.x
Copy link to clipboard
Copied
cefclient is pretty painful to use. Try `chrome://inspect/#devices` instead.
Navigate there, make sure 'Discover network targets' is checked, and click 'Configure'. Add your debug port as 'localhost:nnnn' and click 'Done'.
Your CEF session should appear in the list of Targets after a few seconds. Click 'inspect', and enjoy an even better debug experience than you had previously.
Copy link to clipboard
Copied
Hello,
Thanks for your response.
I tried. I can see my remoteTarget but when I click 'inspect' nothing happens !
Copy link to clipboard
Copied
In addition to what has been said by funkelodeon...
you need to set up port fowarding as well.
is the button above to configure button.
With both set it up... it works 😉
Copy link to clipboard
Copied
Oh man, I have to say a huuuuuge THANK YOU for this solution that worked well for me : now I'm able to debug and use sourcemaps with my application again. Months I've been struggling with this problem. Using Chromium 79 worked but couldn't handle sourcemaps, which is a big pain in the a...
Now everything is great, even better than with the previous devTools.
Thank you, thank you, thank you !!!
@adobe : it's a shame that you didn't document this solution or provide an alternative for you users.
Copy link to clipboard
Copied
Hi there,
Thanks a lot for your answer! It works great!
That should be the official statement from Adobe...
Cheers
Copy link to clipboard
Copied
Today I faced the same problem.
The issue is with Chrome v80+. Chrome has deprecated some features in it's api.
So there are the next workarounds:
1. Downgrade Chrome
2. Use CefClient
3. Configure Chrome v80+ as @funkelodeon mentioned and then use a new debugging window.
Here is my video instructions
4. Run Chrome v80+ with an extra cli flags:
/Applications/Google\ Chrome.app/Contents/MacOS/Google\ Chrome --enable-blink-features=ShadowDOMV0,CustomElementsV0Here is my video instructions on macOs
Thanks to:
@Kawano_Shuji
@Ten A
@funkelodeon
Copy link to clipboard
Copied
Thanks man, for the video instructions 😉
Find more inspiration, events, and resources on the new Adobe Community
Explore Now
