Inspiring
October 28, 2017
Answered

Add labels to x and y axis for scatter graph

  • October 28, 2017
  • 1 reply
  • 6105 views

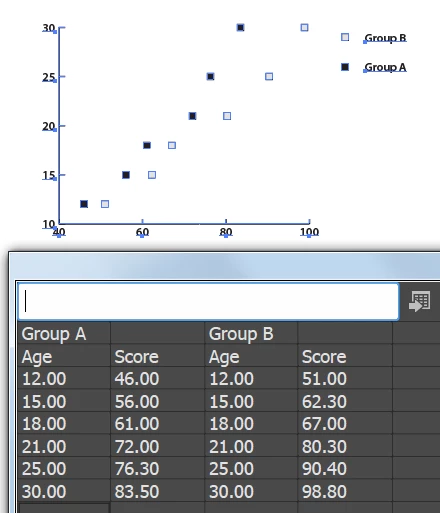
How do I enter the data for a scatter graph so that I can get a label on the X and Y axis?

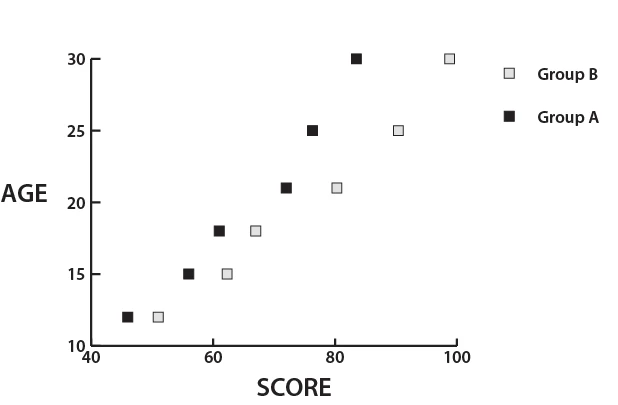
In the example below, I would like to add AGE to the X axis and SCORE to the Y axis.

I want it to look like this, but these are labels I added manually. I'd like to know how to have Illustrator add them to the graph automatically.

    This topic has been closed for replies.
    Correct answer Monika Gause

    You can't do that automatically.

    1 reply

    Larry G. Schneider
    Community Expert
    Community Expert
    October 28, 2017

    Have you tried using quotes around the age/score inserts?

    Inspiring
    October 28, 2017

    Your answer gave me hope, but unfortunately, that didn't do it.

    Inspiring
    October 28, 2017

    You can't do that automatically.


    Monika, Thank you for confirming that.

    It's been difficult to find information about Illustrator graphs. Even the Adobe help file is skimpy. If you can recommend any good (by that I mean thorough) reference material, please let me know.