- Home
- Illustrator
- Discussions
- Add labels to x and y axis for scatter graph
- Add labels to x and y axis for scatter graph
Copy link to clipboard
Copied
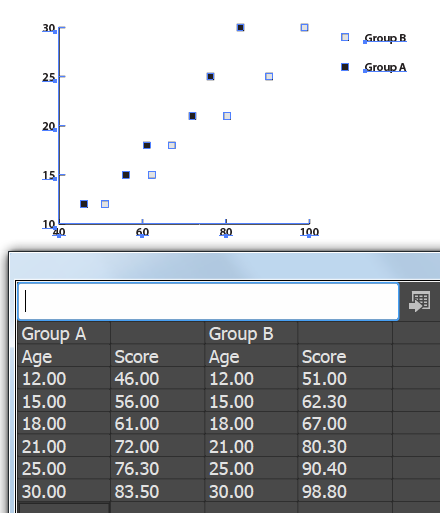
How do I enter the data for a scatter graph so that I can get a label on the X and Y axis?
In the example below, I would like to add AGE to the X axis and SCORE to the Y axis.

I want it to look like this, but these are labels I added manually. I'd like to know how to have Illustrator add them to the graph automatically.

 1 Correct answer
You can't do that automatically.
Explore related tutorials & articles
Copy link to clipboard
Copied
Have you tried using quotes around the age/score inserts?
Copy link to clipboard
Copied
Your answer gave me hope, but unfortunately, that didn't do it.

Copy link to clipboard
Copied
You can't do that automatically.
Copy link to clipboard
Copied
Monika, Thank you for confirming that.
It's been difficult to find information about Illustrator graphs. Even the Adobe help file is skimpy. If you can recommend any good (by that I mean thorough) reference material, please let me know.
Copy link to clipboard
Copied
The best reference material is perhaps some old manual. The manual for version 5 (not CS5) has a rumour of being quite thorough in this respect. Personally I don't know it unfortunately. The graph function has been introduced in version 3, so that manual might be quite good as well.
I have written a (German) book about it and it also has an extensive chapter about graphs. But that possibly doesn't help you 🙂
Find more inspiration, events, and resources on the new Adobe Community
Explore Now