Question
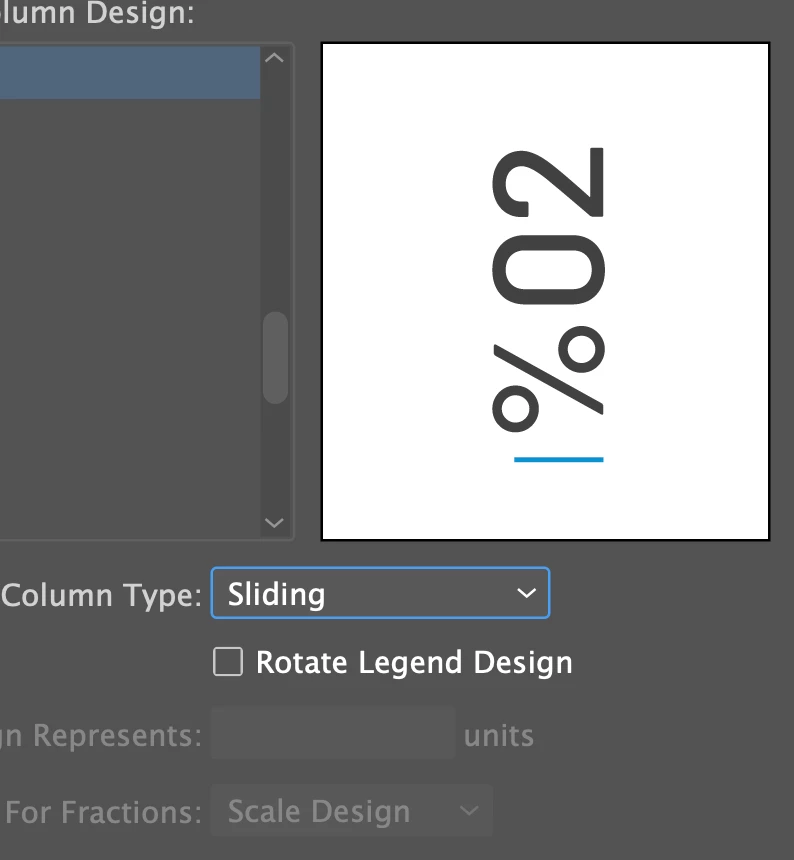
Bar graph values shifts to minus (Sliding option)
Hello all,
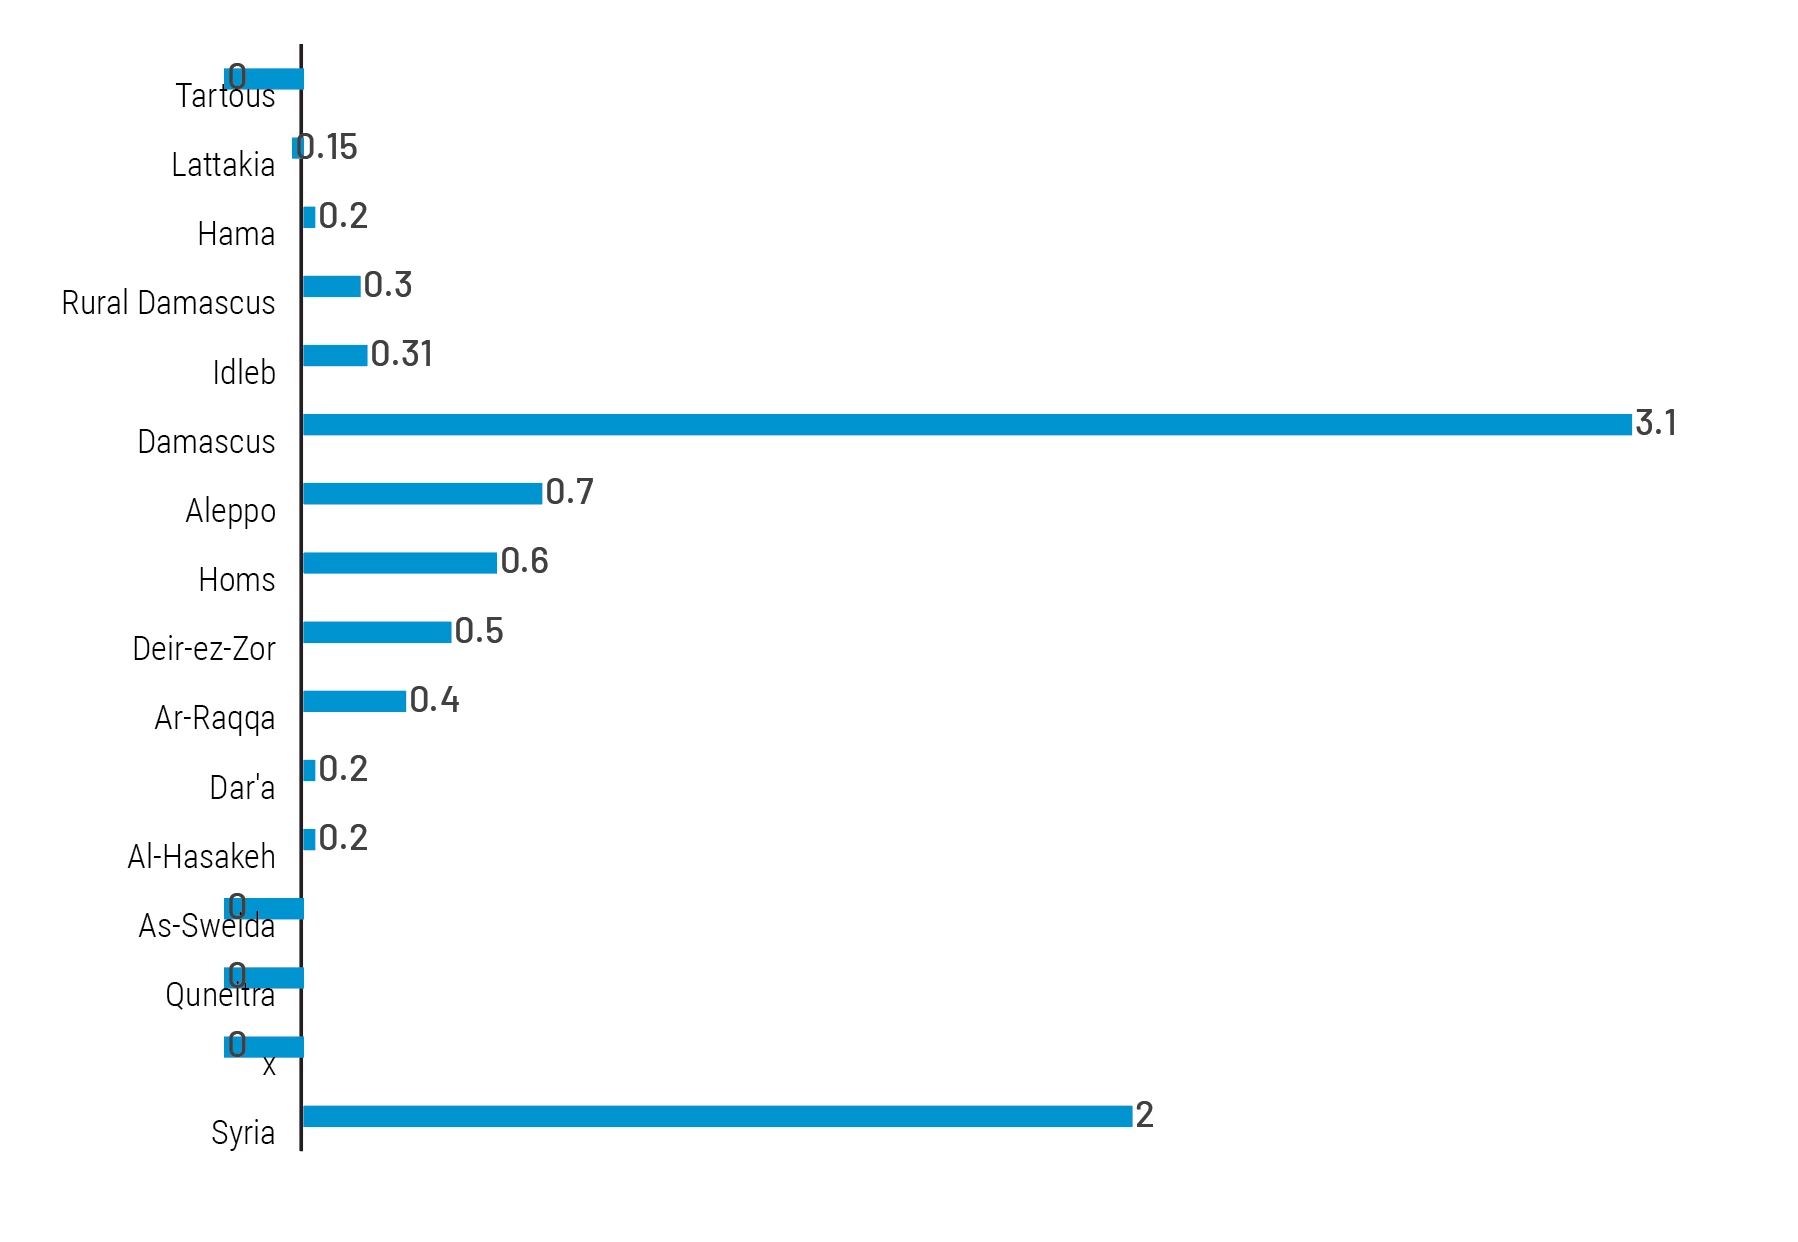
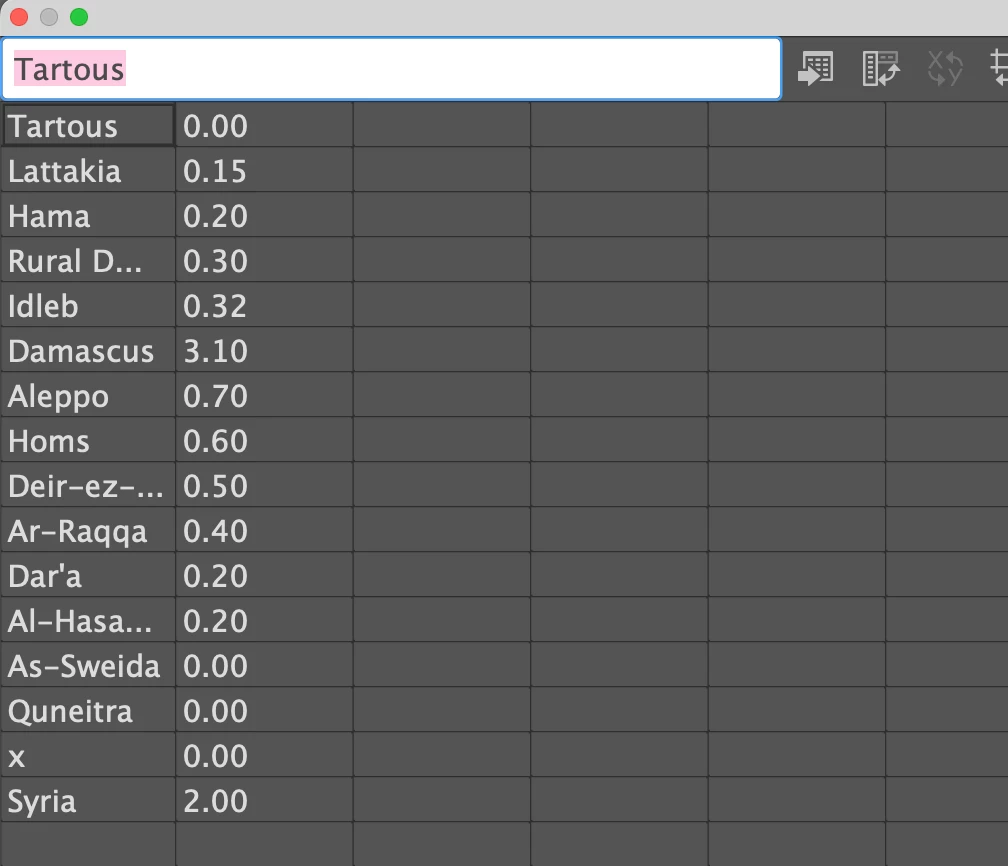
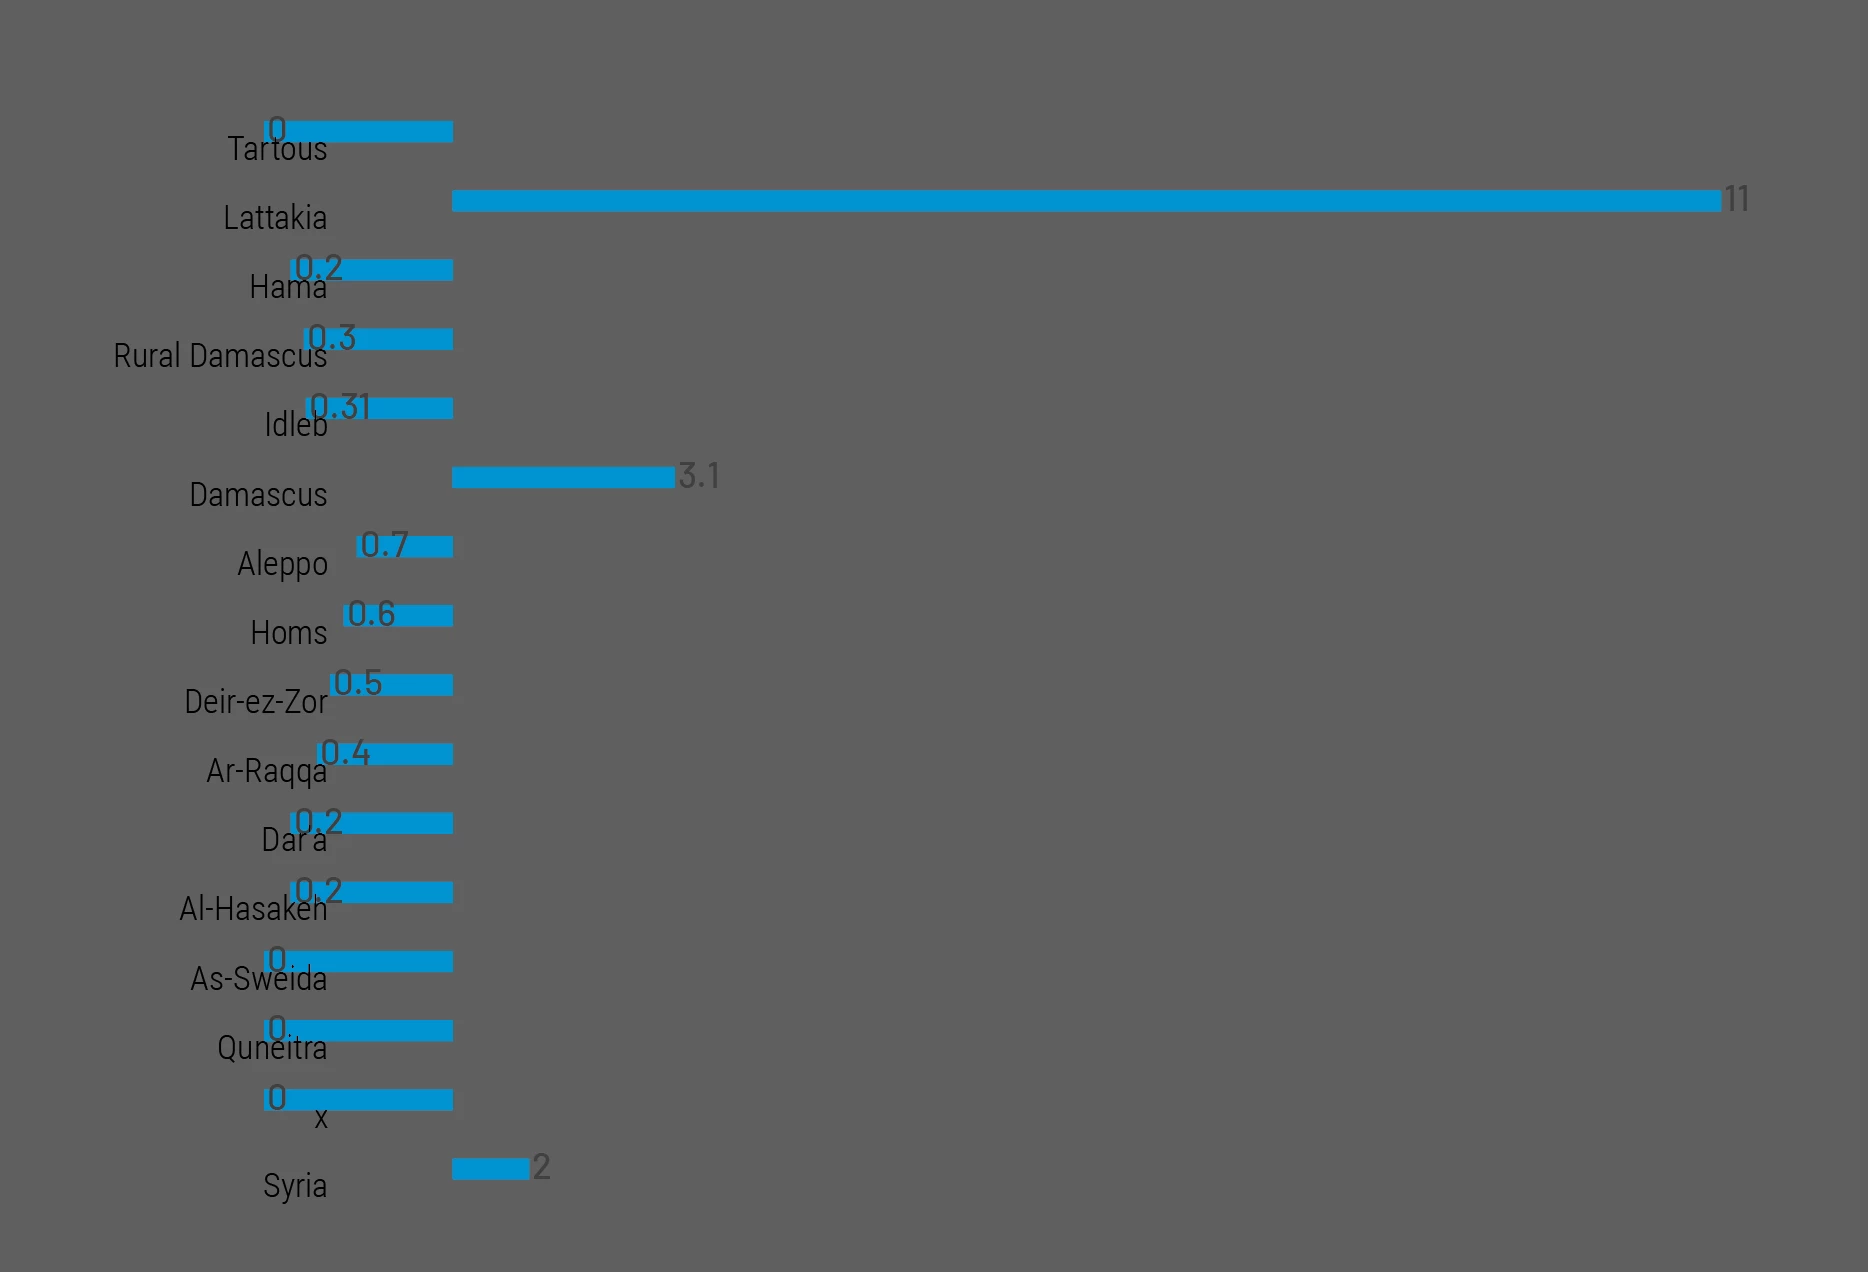
I have prepared a column design with a value (%02) to use in my bar graph, when i chose this column design and use the (sliding) option, some values shifts to minus (left side of the graph), please note that the bigger the gap is in data, the more numbers that goes to the left side of the graph. for example; if i increased the max number to 11 and minumum number is 0, more columns will shift to the minus.
This issue only appears when i want to include numbers with dicimals,(%01 /%02 /%03 ...) and not when i use complete numbers (%00).
Attached screenshots
I have tried many things with no luck, please advise how to overcome this