Copy link to clipboard
Copied
Hi everyone,
I'm new here, but I ran into a problem.
Somehow i made my object in Isolation mode?
Anyway when I try to save my picture or when i exit isolation mode, the clipping mask layer disappears..
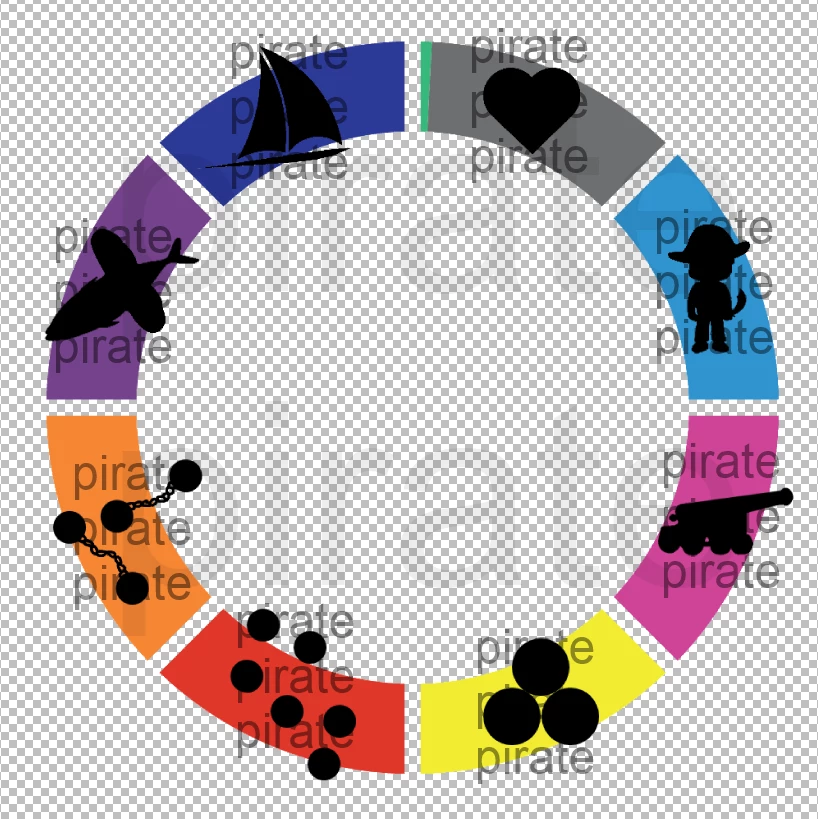
I want it to look like this (without the lines ofcourse),
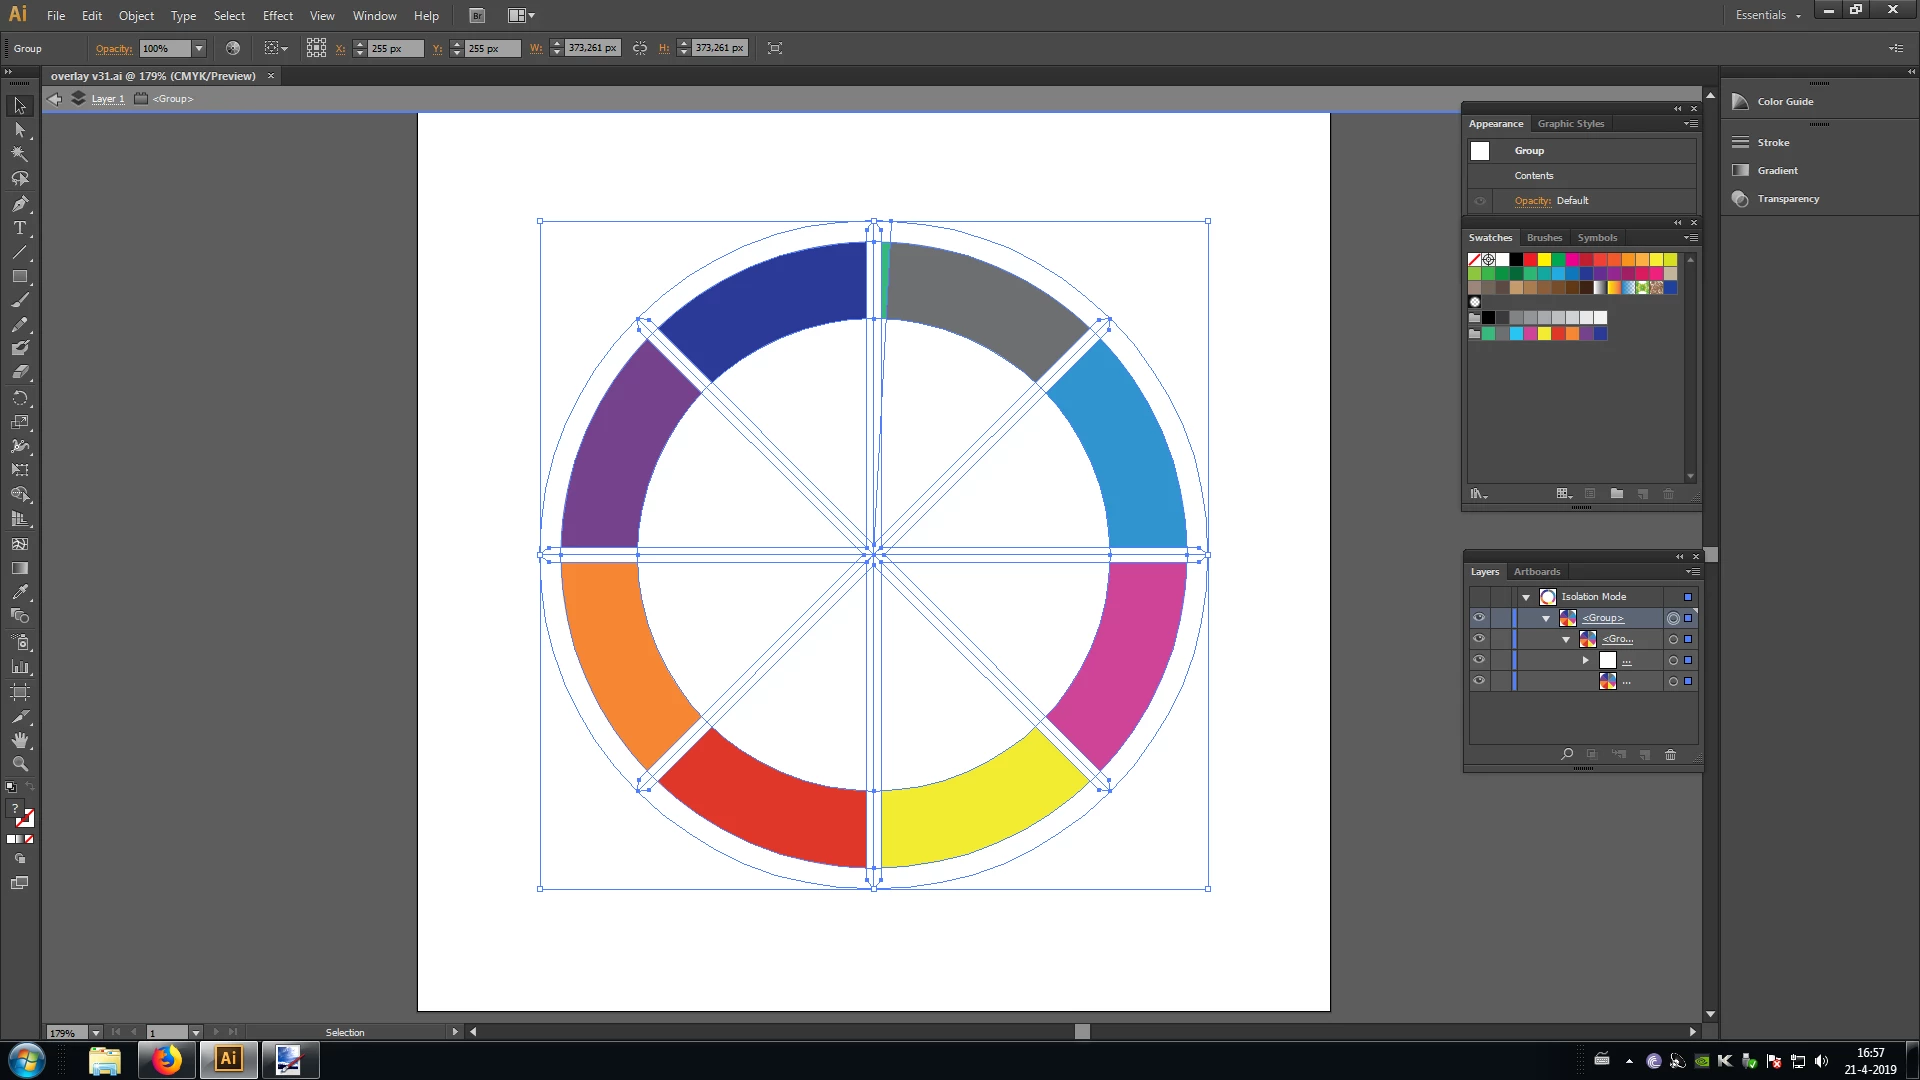
but when i save it, it turns out like this:
I already spent hours and hours trying to fix this, but I don't have a clue how to solve it.
I tried selecting different layers and groups when saving, but nothing seems to help.
Any suggestions? Thanks in advance
Regards,
Frank
OK, if you need the graph to be a graph, don't ungroup it.
Use the Layers panel to move the graph up and out of any clipping paths.
Then find the clipping path and move it so it is above the graph.
You basically want your art to be arranged like the screen shot I posted.
Your graph will still be numerically linked to the data.
Copy link to clipboard
Copied
Can you check evera one of your objects if it has transparency applied? Such as blend modes or maybe opacity 0% and then there might be knockouts groups in your artwork.
Copy link to clipboard
Copied
Thanks for your reply.
However I checked all the things you mentioned, but there isn't anything wrong.
I haven't worked very long on the image itself, just followed a tutorial, so it shouldnt be that complicated.
When i double click on the image it becomes like I want it to be, but now in Isolation mode. And when I export it or save it, it changes back..
Copy link to clipboard
Copied
Please upload the file to Dropbox, Google Drive or the like.
Copy link to clipboard
Copied
Dropbox - overlay wheel.ai here you go
Would be great if you could find the error!
Copy link to clipboard
Copied
I am not a fan of isolation mode, but I was able to simplify your art to create what you want.
Copy link to clipboard
Copied
There are "nested" knockout groups at the Layer level, Group level and even at the Object level.
You will have to release them and then make a fresh clipping mask.
Copy link to clipboard
Copied
If you can't post the artwork, could you take some screen shots of your Layers panel? There's a lot hidden in there.
Copy link to clipboard
Copied
I posted the artwork file already, but here you go anyway Dropbox - overlay wheel.ai
Copy link to clipboard
Copied
I posted my artwork with the file fixed. Not sure what your problem is/was. But I know my art is simpler
Copy link to clipboard
Copied
In case anyone is wondering, here's what the Layers panel of my fix looks like.
Copy link to clipboard
Copied
Don't know what happened, but here is the link to my fix:
Copy link to clipboard
Copied
I can't tell you what happened, but: there were too many masks in your hierarchy.
Basically: ungroup until Illustrator tells you there is nothing more to ungroup.
Then just select both items and Object > Clipping mask > Make
Copy link to clipboard
Copied
Monika,
Your way is very simple. I did the same thing by moving the groups up the layer hierarchy in the panel. Same result.
Copy link to clipboard
Copied
Thank you both very much for doing this. It's a nice fix
Howeverr i forgot to mention that the data (its a graph) in there needs to be editable.
I can't edit it anymore now?
The upper small green one is the first example already made. % in stock visible in that category.
For the rest it is gray.
I'm sorry that i didnt mention it before, but I do need it for this to be useful
Copy link to clipboard
Copied
I work in CS6. What version is your graph made on? Because on your layer screenshot I can actually see 'Graph'
Copy link to clipboard
Copied
frankwessels schrieb
I work in CS6. What version is your graph made on? Because on your layer screenshot I can actually see 'Graph'
You just need to ungroup your version and then create the clipping mask. Sandee most probably used a higher version than yours.
Copy link to clipboard
Copied
OK, if you need the graph to be a graph, don't ungroup it.
Use the Layers panel to move the graph up and out of any clipping paths.
Then find the clipping path and move it so it is above the graph.
You basically want your art to be arranged like the screen shot I posted.
Your graph will still be numerically linked to the data.
Copy link to clipboard
Copied
Yes this works!
Thank you very much
Find more inspiration, events, and resources on the new Adobe Community
Explore Now