Hi @grafik2_5837, I've written a quick script to do this. Give it a try and let me know if it works for your case. I've configured the `adjustCMYKColor` function to match your logic. You can set the `cellCount`, `gap` and `colorStep` values.
- Mark
/**
* @file Make Color Grid CMYK.js
*
* Usage:
* 1. Draw a square in Illustrator, the size you want the color grid.
* 2. Color the square (in CMYK for this example).
* 3. Run script.
*
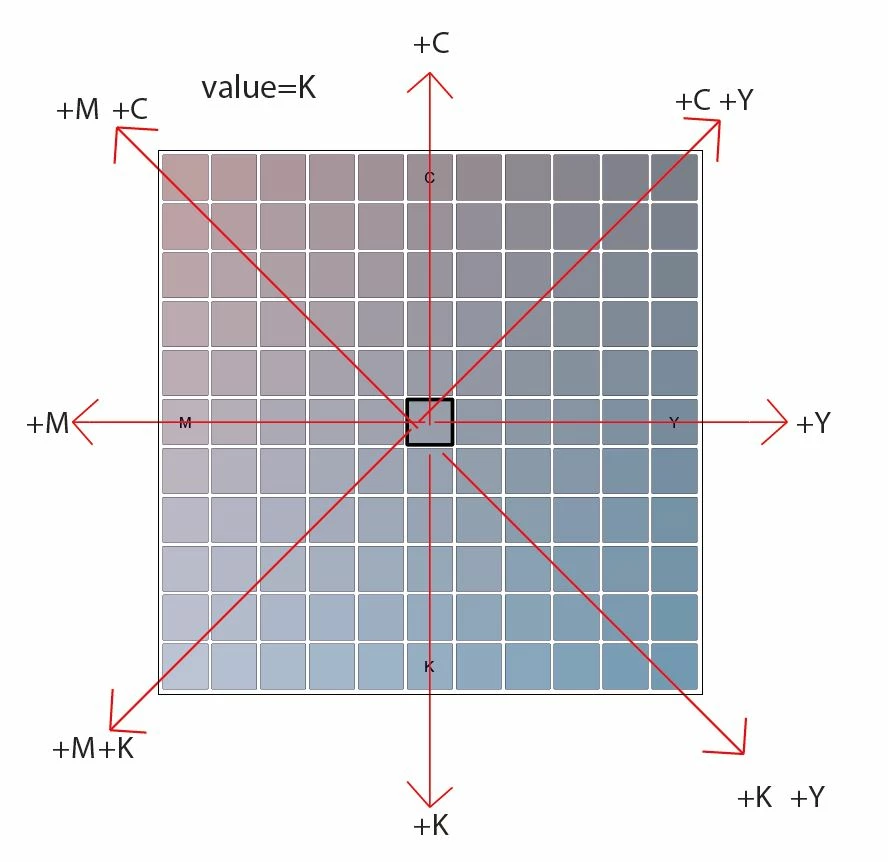
* Draws a grid squares over the selected square, with the original color
* in the center, and with colors radiating out with modified values.
*
* Color values are modified by the `colorFunction`, eg. the example `increaseColorValues`.
*
* @author m1b
* @version 2025-05-30
* @discussion https://community.adobe.com/t5/illustrator-discussions/cmyk-table-with-vary-by-value-k/m-p/14888873
*/
(function () {
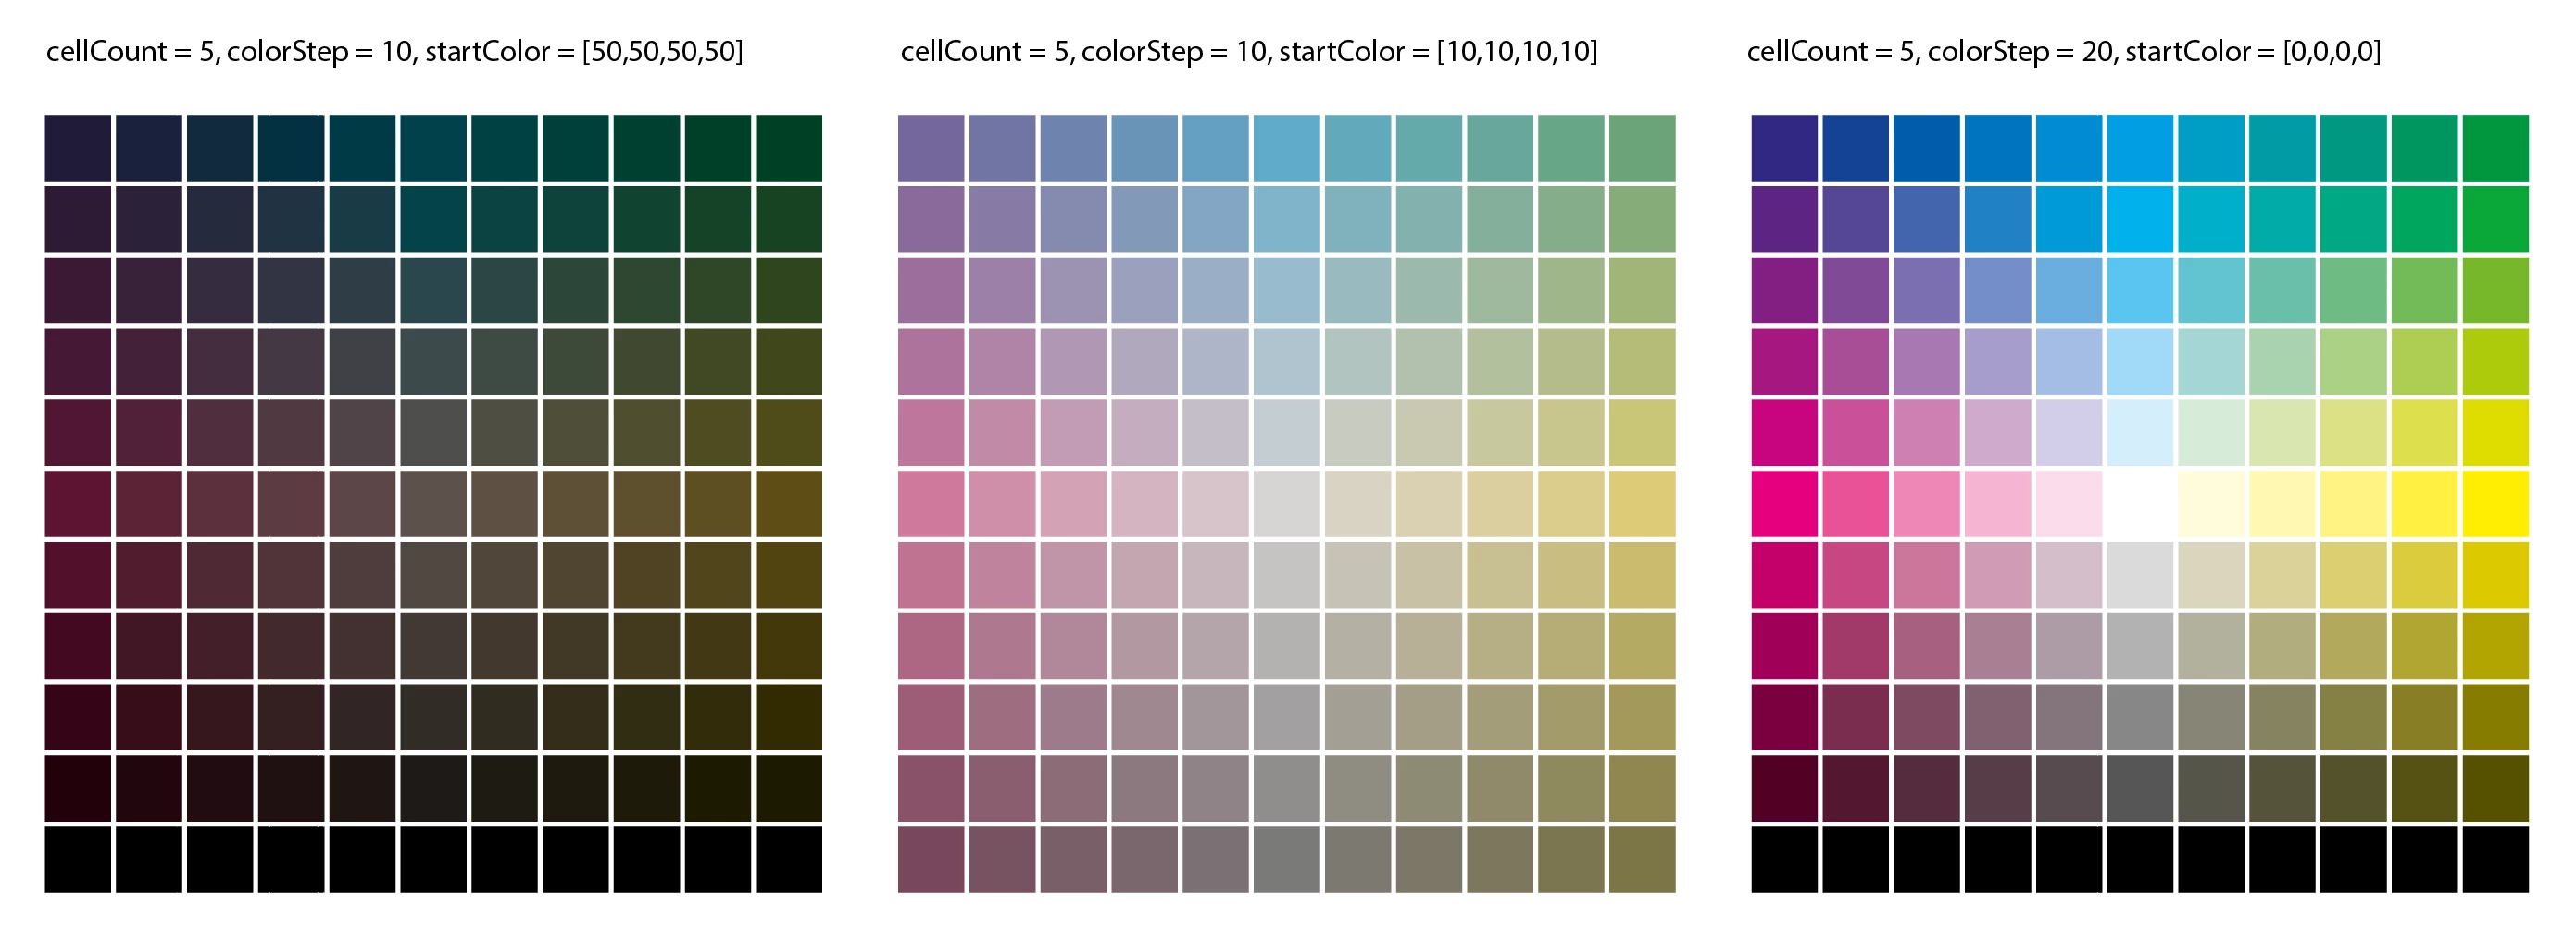
var settings = {
autoSteps: true,
cellCount: 5,
gap: 2,
colorStep: 2,
showUI: true,
};
var doc = app.activeDocument,
item = doc.selection[0];
if (
!item
|| !item.hasOwnProperty('fillColor')
|| !item.hasOwnProperty('geometricBounds')
)
return alert('Please select a colored square and try again.');
settings.centralColor = item.fillColor;
if (settings.showUI) {
var result = ui(settings);
if (2 === result)
// user cancelled
return;
}
// calculate the step for each channel (if auto) or use the settings value for all channels
var cyanStep = settings.autoSteps ? (100 - settings.centralColor.cyan) / settings.cellCount : settings.colorStep;
var magentaStep = settings.autoSteps ? (100 - settings.centralColor.magenta) / settings.cellCount : settings.colorStep;
var yellowStep = settings.autoSteps ? (100 - settings.centralColor.yellow) / settings.cellCount : settings.colorStep;
var blackStep = settings.autoSteps ? (100 - settings.centralColor.black) / settings.cellCount : settings.colorStep;
// make the color grid!
makeColorGrid(doc, item, settings.cellCount, settings.gap, increaseColorValues);
// or here is an example of using a custom `drawCellFunction`:
// makeColorGrid(doc, item, settings.cellCount, settings.gap, increaseColorValues, drawCellWithDarkerCells);
// ------------------- end of demo script ------------------------------------
/**
* Use as a `colorFunction` parameter with `makeColorGrid`.
*
* Returns a new color, by increasing the color values
* as the grid location is further from the center.
* @param {Number} x - the x coordinate of the grid.
* @param {Number} y - the y coordinate of the grid.
* @returns {Color}
*/
function increaseColorValues(x, y) {
var cyan = settings.centralColor.cyan,
magenta = settings.centralColor.magenta,
yellow = settings.centralColor.yellow,
black = settings.centralColor.black;
if (x < 0)
magenta -= x * magentaStep;
else if (x > 0)
yellow += x * yellowStep;
if (y < 0)
cyan -= y * cyanStep;
else if (y > 0)
black += y * blackStep;
return makeColor([
Math.min(cyan, 100),
Math.min(magenta, 100),
Math.min(yellow, 100),
Math.min(black, 100),
]);
};
/**
* Use as a `drawCellFunction` parameter with `makeColorGrid`.
*
* Draws a color cell with smaller, darker, cells embedded.
* @param {Document} doc - an Illustrator Document.
* @param {Array<Number>} rect - [L, T, W, H].
* @param {Color} color - the color of the cell.
* @param {*} container - the location (parent) of the drawn cell.
* @returns {GroupItem} - the main cell grouped with the small cells.
*/
function drawCellWithDarkerCells(doc, rect, color, container) {
// keep the cells in a group
var group = container.groupItems.add();
// draw the main cell
drawRectangle(doc, rect, undefined, group, { fillColor: color });
// darker colors
var darker = [
makeColor([color.cyan, color.magenta, color.yellow, Math.min(color.black + 25, 100)]),
makeColor([color.cyan, color.magenta, color.yellow, Math.min(color.black + 50, 100)]),
makeColor([color.cyan, color.magenta, color.yellow, Math.min(color.black + 75, 100)]),
];
var smallCellSize = rect[2] / darker.length;
// draw the smaller cells
for (var i = 0, b; i < darker.length; i++) {
b = [
rect[0] + smallCellSize * i,
rect[1] + rect[2] - smallCellSize,
smallCellSize,
smallCellSize,
];
drawRectangle(doc, b, undefined, group, { fillColor: darker[i] });
}
return group;
};
})();
/**
* Divides a square into smaller squares
* such that there will be a central square,
* and `stepCount` squares along x and y axes.
* The squares can be colored using a provided
* function.
* @author m1b
* @version 2024-10-01
* @param {Document} doc - an Illustrator Document.
* @param {PageItem} item - a page item used for position and size (will be removed).
* @param {Number} cellCount - the number of squares out from the central square.
* @param {Number} [gap] - the gap between squares, in points (default: 0).
* @param {Function} colorFunction - a function that, given cell coordinates, returns a color.
* @param {Function} drawCellFunction - a function that, given cell bounds and color, draws the cell.
*/
function makeColorGrid(doc, item, cellCount, gap, colorFunction, drawCellFunction) {
gap = gap || 0;
drawCellFunction = drawCellFunction || basicDrawCellFunction;
// calculate size of everything
var center = centerOfBounds(item.geometricBounds),
width = item.geometricBounds[2] - item.geometricBounds[0],
allSteps = (cellCount * 2) + 1,
cellSize = (width - (gap * (allSteps - 1))) / allSteps;
// offset to the corner of the cell
center[0] -= cellSize / 2;
center[1] -= cellSize / 2;
// draw the grid
for (var u = -cellCount, cellRect, x, y, c; u <= cellCount; u++) {
for (var v = -cellCount; v <= cellCount; v++) {
x = center[0] + (u * (cellSize + gap));
y = center[1] + (v * (cellSize + gap));
cellRect = [x, y, cellSize, cellSize];
c = colorFunction(u, v);
drawCellFunction(doc, cellRect, c, item.parent);
}
}
// remove the original square
item.remove();
/**
* Basic function to draw the cell.
* @param {Document} doc
* @param {Array<Number>} cellRect
* @param {Color} color
* @param {Document|Layer|GroupItem} container
*/
function basicDrawCellFunction(doc, cellRect, color, container) {
return drawRectangle(doc, cellRect, undefined, container, { fillColor: color });
};
};
/**
* Draws a rectangle in the container.
* Takes Large Scale Documents into account.
* @author m1b
* @version 2024-09-26
* @param {Document} doc - an Illustrator document.
* @param {Array<Number>} rect - the rectangle dimensions [left, top, width, height].
* @param {Number} [unitFactor] - eg. 72 to convert to inches. All values will be scaled by this (default: 1).
* @param {Document|Layer|GroupItem} [container] - an Illustrator page item container (default: doc).
* @param {Object} [props] - properties to assign to the rectangle (default: none).
* @return {PathItem}
*/
function drawRectangle(doc, rect, unitFactor, container, properties) {
properties = properties || {};
unitFactor = unitFactor || 1;
container = container || doc;
var sf = 1 / doc.scaleFactor * unitFactor;
var rectangle = container.pathItems.rectangle(-rect[1] * sf, rect[0] * sf, rect[2] * sf, rect[3] * sf); // T,L,W,H
// defaults
rectangle.filled = true;
rectangle.stroked = false;
// apply properties
for (var key in properties)
if (
properties.hasOwnProperty(key)
&& undefined != properties[key]
)
rectangle[key] = properties[key];
return rectangle;
};
/**
* Returns point at center of bounds.
* Works with Illustrator or Indesign bounds.
* @author m1b
* @version 2024-09-14
* @param {Array} bounds - a bounds array.
* @returns {Array} - point array [x, y].
*/
function centerOfBounds(bounds) {
return [
bounds[0] + (bounds[2] - bounds[0]) / 2,
-bounds[1] - (bounds[3] - bounds[1]) / 2
];
};
/**
* Makes a color from a array of color values;
* @author m1b
* @version 2022-10-03
* @param {Array<Number>} breakdown - the color values.
* @returns {GrayColor|RGBColor|CMYKColor}
*/
function makeColor(breakdown) {
var c;
if (breakdown.length == 1) {
c = new GrayColor();
c.gray = Math.min(breakdown[0], 100);
}
else if (breakdown.length == 3) {
c = new RGBColor();
c.red = Math.min(breakdown[0], 255);
c.green = Math.min(breakdown[1], 255);
c.blue = Math.min(breakdown[2], 255);
}
else if (breakdown.length == 4) {
c = new CMYKColor();
c.cyan = Math.min(breakdown[0], 100);
c.magenta = Math.min(breakdown[1], 100);
c.yellow = Math.min(breakdown[2], 100);
c.black = Math.min(breakdown[3], 100);
}
return c;
};
/**
* Rounds a number to `places` decimal places.
* @author m1b
* @version 2022-08-02
* @param {Number} num - the Number to round.
* @param {Number} [places] - round to this many decimal places.
* @return {Number} - the rounded Number.
*/
function round(num, places) {
places = Math.pow(10, places || 1);
return Math.round(num * places) / places;
};
/**
* UI for "Make Color Grid".
* @param {Object} settings - an object accessed by the UI.
* @returns {Number} - 1 == success, 2 == user cancelled.
*/
function ui(settings) {
var w = new Window("dialog", 'Make Color Grid'),
columns = w.add('group {orientation:"row", alignment:["fill","fill"], alignChildren: ["fill","top"], margins:[0,0,0,0] }'),
column1 = columns.add('group {orientation:"column", alignment:["fill","top"], alignChildren: ["fill","top"], margins:[10,10,10,20] }'),
column2 = columns.add('group {orientation:"column", alignment:["fill","top"], alignChildren: ["fill","top"], margins:[10,10,10,20] }'),
colorLabel = column1.add("statictext { text: 'Central Color:', alignment: ['left','top'] }"),
cyanGroup = column1.add('group {orientation:"row", alignment:["fill","fill"], alignChildren: ["fill","center"], margins:[0,0,0,0] }'),
cyanLabel = cyanGroup.add("statictext { text: 'C', alignment: ['left','center'], preferredSize:[12,-1] }"),
cyanField = cyanGroup.add("edittext { text: '', preferredSize: [50,-1], alignment:['left','center'] }"),
magentaGroup = column1.add('group {orientation:"row", alignment:["fill","fill"], alignChildren: ["fill","center"], margins:[0,0,0,0] }'),
magentaLabel = magentaGroup.add("statictext { text: 'M', alignment: ['left','center'], preferredSize:[12,-1] }"),
magentaField = magentaGroup.add("edittext { text: '', preferredSize: [50,-1], alignment:['left','center'] }"),
yellowGroup = column1.add('group {orientation:"row", alignment:["fill","fill"], alignChildren: ["fill","center"], margins:[0,0,0,0] }'),
yellowLabel = yellowGroup.add("statictext { text: 'Y', alignment: ['left','center'], preferredSize:[12,-1] }"),
yellowField = yellowGroup.add("edittext { text: '', preferredSize: [50,-1], alignment:['left','center'] }"),
blackGroup = column1.add('group {orientation:"row", alignment:["fill","fill"], alignChildren: ["fill","center"], margins:[0,0,0,0] }'),
blackLabel = blackGroup.add("statictext { text: 'K', alignment: ['left','center'], preferredSize:[12,-1] }"),
blackField = blackGroup.add("edittext { text: '', preferredSize: [50,-1], alignment:['left','center'] }"),
cellCountGroup = column2.add('group {orientation:"row", alignment:["right","fill"], alignChildren: ["right","center"], margins:[0,0,0,0] }'),
cellCountLabel = cellCountGroup.add("statictext { text: 'Cell count:', justify:'right', alignment: ['right','center'], preferredSize:[95,-1] }"),
cellCountField = cellCountGroup.add("edittext { text: '', preferredSize: [50,-1], alignment:['left','center'] }"),
gapGroup = column2.add('group {orientation:"row", alignment:["fill","fill"], alignChildren: ["fill","center"], margins:[0,0,0,0] }'),
gapLabel = gapGroup.add("statictext { text: 'Gap:', justify:'right', alignment: ['right','center'], preferredSize:[95,-1] }"),
gapField = gapGroup.add("edittext { text: '', preferredSize: [50,-1], alignment:['left','center'] }"),
autoStepsCheckBox = column2.add("checkBox { text: 'Auto step', value: false, alignment:['right','top'] }"),
colorStepGroup = column2.add('group {orientation:"row", alignment:["fill","fill"], alignChildren: ["fill","center"], margins:[0,0,0,0], visible: true }'),
colorStepLabel = colorStepGroup.add("statictext { text: 'Colour step %:', justify:'right', alignment: ['right','center'], preferredSize:[95,-1] }"),
colorStepField = colorStepGroup.add("edittext { text: '', preferredSize: [50,-1], alignment:['left','center'] }"),
buttons = w.add("Group {orientation:'row', alignment:['right','top'] }"),
cancelButton = buttons.add('button', undefined, 'Cancel', { name: 'cancel' }),
applyButton = buttons.add('button', undefined, 'Apply', { name: 'ok' });
applyButton.onClick = apply;
autoStepsCheckBox.onClick = refreshUI;
function refreshUI() {
colorStepGroup.visible = !autoStepsCheckBox.value;
};
updateUI();
w.center();
return w.show();
function updateUI() {
// update the SUI controls from settings
cyanField.text = round(settings.centralColor.cyan, 1);
magentaField.text = round(settings.centralColor.magenta, 1);
yellowField.text = round(settings.centralColor.yellow, 1);
blackField.text = round(settings.centralColor.black, 1);
cellCountField.text = settings.cellCount;
gapField.text = settings.gap;
colorStepField.text = settings.colorStep;
autoStepsCheckBox.value = settings.autoSteps;
refreshUI();
};
function apply() {
// update settings from SUI controls
settings.centralColor.cyan = Number(cyanField.text);
settings.centralColor.magenta = Number(magentaField.text);
settings.centralColor.yellow = Number(yellowField.text);
settings.centralColor.black = Number(blackField.text);
settings.cellCount = Number(cellCountField.text);
settings.gap = Number(gapField.text);
settings.colorStep = Number(colorStepField.text);
settings.autoSteps = autoStepsCheckBox.value;
// return approval code
w.close(1);
};
};
Edit 2024-10-01: oops, forgot to add screenshot.
Edit 2024-10-01: added UI.
Edit 2025-05-30: fixed bad bug—a typo—that I must have introduced during the last update that ruined the whole script (it's been broken for 7 months! Sorry!) Also added a "AutoStep" settings and UI. AutoStep means it calculates the step amount for a color such that the outer grid square always is 100% of that color. Turn this off if you want exact control. I also included an example custom drawCellFunction that draws the main cell plus three smaller, darker cells over it. This example is currently commented out.