Coloring map using data file (CSV)
I'm seeking a scripting solution for using a data file (like Excel or CSV) to apply colors to a county map. I'm a scripting noob but usually understand enough to modify script I find for my purposes. And I have found a few scripts out there, including one here on this forum, but am struggling to apply it correctly.
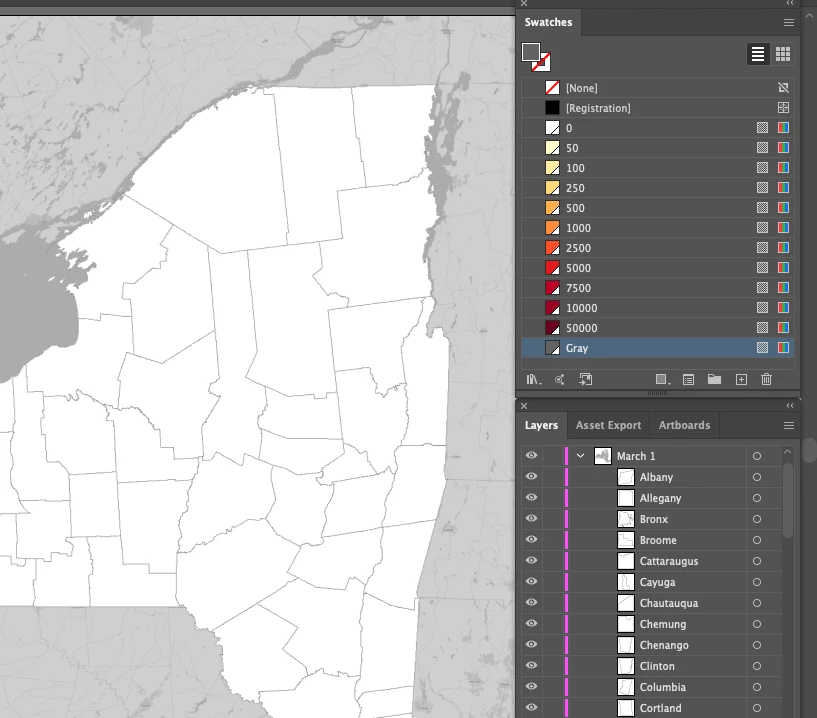
The particulars of my project: I have a map of NY state, with each county an object on a separate sublayer of a layer group; the layer group represents a date. I want to color the counties by the number of cases of coronavirus on that date. Eventually there will be 40 more layer groups — one for each day since the outbreak started — and they'll be imported into Premiere to create a timeline video of the spread.
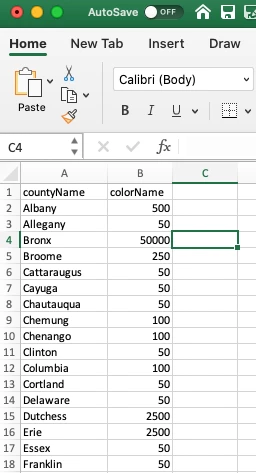
My CSV file has the name of the county and name of a color, which aligns to a color name in my palette. I also have the number of positives cases on that date and also want to pull that text into a text box on top of the county. I haven't gotten that far yet — still trying to solve for coloring the counties.
Here are a couple of screenshots that I hope explain what I'm trying to do. I appreciate any help the community can offer!