complex graphs with excel data
Copy link to clipboard
Copied
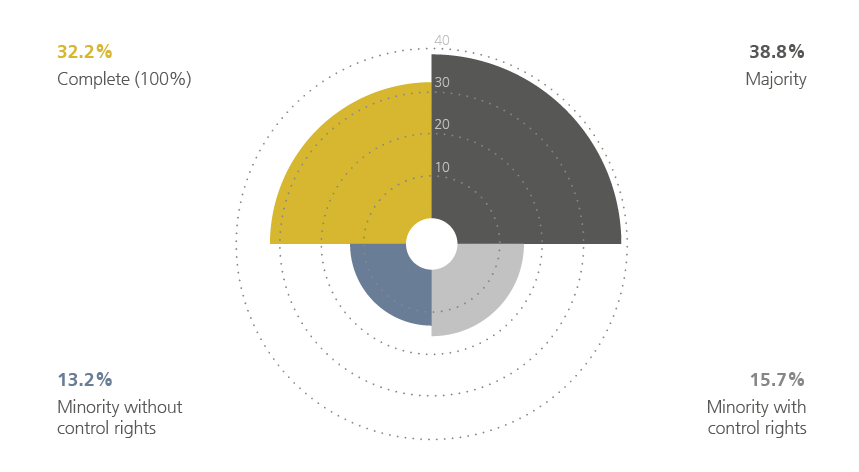
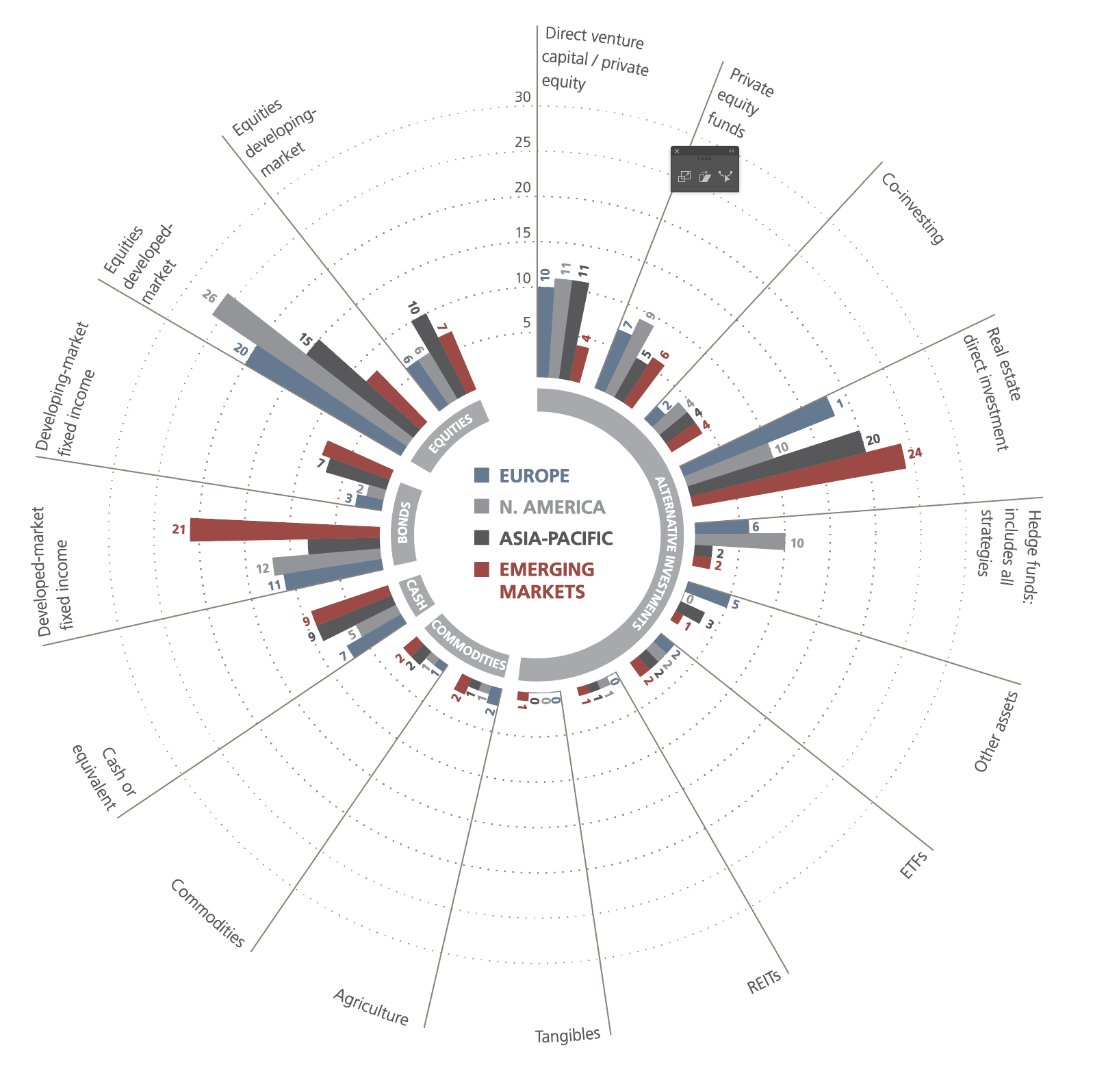
Hi, does anybody know how to do these kind of charts in illustrator? Plugin or special program??


Explore related tutorials & articles
Copy link to clipboard
Copied
You can't do them with Illustrator. Maybe d3 can do them.
Copy link to clipboard
Copied
thank you vermuch oder danke sehr, kenn mich nicht aus mit d3
Copy link to clipboard
Copied
The first two graphs can be plotted in Illustrator using the existing graph tools.

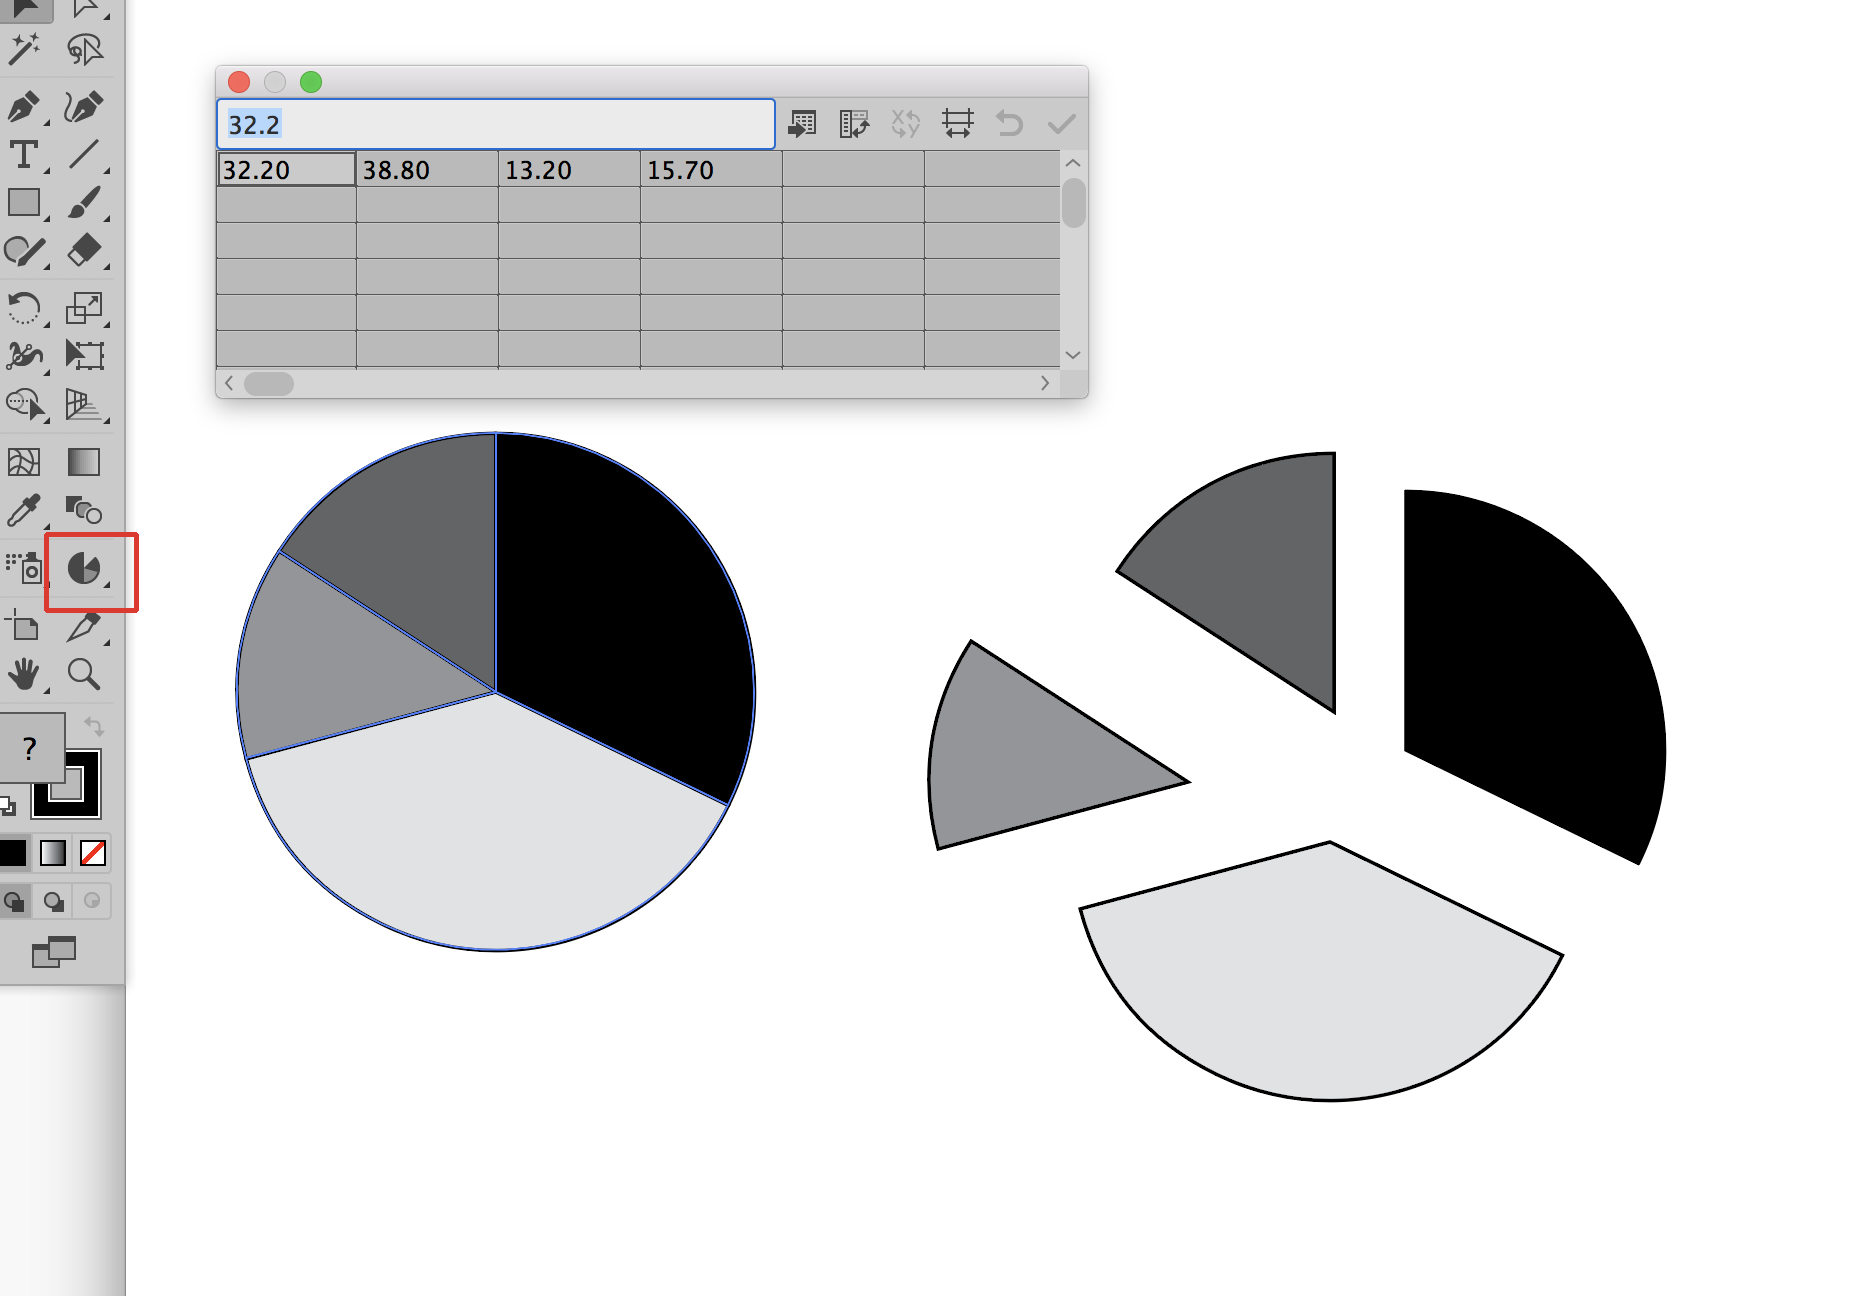
In the screen shot above I used your percentages from your top graph to plot a pie chart using that option from the graph tools (see tool highlighted in red). It created the pie chart shown above left. In the copy of that on the right you can see that each piece of the pie is a separate piece that you can move and manipulate as needed. However, once you start to move things around the graph will either no longer be controlled by the graph data or, if the link is still maintained, any change to the data will most likely revert the graph to its original state. I say most likely because I've found that this feature always surprises me with what customization you can get away with before you lose the link. Definitely if you ungroup the graph you'll lose the link. I would suggest making a copy of the graph as I did here to do any customizing and leave the original as no stroke and no fill (viewable only in the artwork mode) so that if you need to replot anything you can do so and then use that as a basis for manually fixing the customized version. Unfortunately, the Illustrator graph feature has not been updated since its inception and as far as making something as customized as your examples this is as far as it goes. However, I did find a link for you for a plug-in which you might find helpful: How to Create Infographic Elements with VectorScribe in Illustrator - Astute Graphics . I cannot personally vouch for the plug-in but it does appear to be talking about what you did ask for.
The final graph you presented could be plotted as a bar graph but it is so specifically designed that I can't offer any specific way to automate it.
Copy link to clipboard
Copied
you will need to roll up your sleeve and make those by hand, there is no tool in illustrator that will automatically generate those kinds of charts. the chart making tool in illustrator is super basic, it does not work well and it neglected.
Find more inspiration, events, and resources on the new Adobe Community
Explore Now

