Exit
  • Global community
    • Language:
      • Deutsch
      • English
      • Español
      • Français
      • Português
  • 日本語コミュニティ
  • 한국 커뮤니티
0

How can I use the line graph tool to create a graph with x and y axis values for multiple items

Explorer ,
Feb 18, 2021 Feb 18, 2021

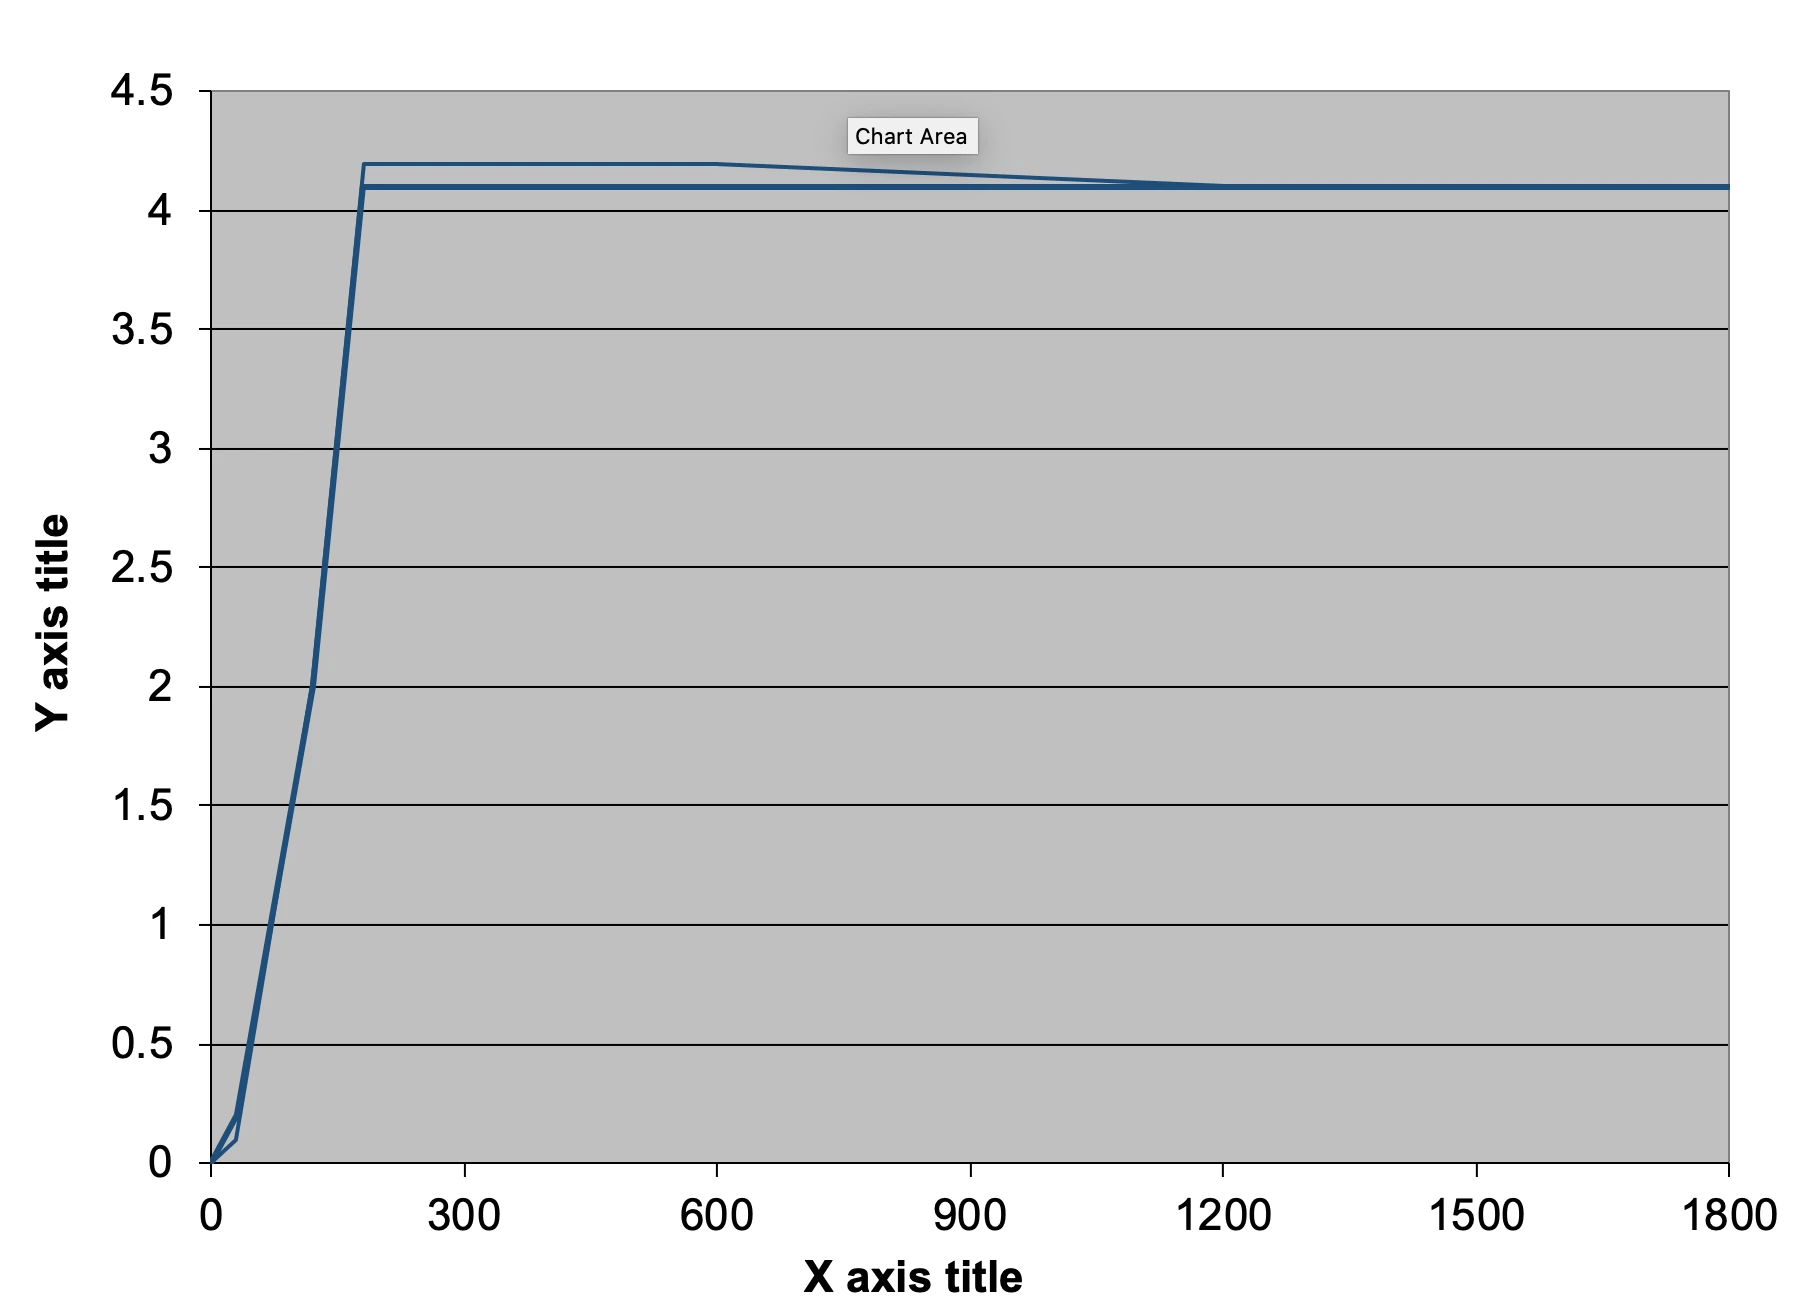
Hi I was wondering if it was possible to create a graph like the one shown below with the graph tool in Illustrator. I can manually add the titles so that's not to much of a problem but I've not found a way to add values to the x and y axis whilst having more than one line on the graph, is it possible to make the below?Screenshot 2021-02-18 at 13.20.32.pngexpand image

TOPICS
Draw and design , Tools
200
Translate
Report
Community guidelines
Be kind and respectful, give credit to the original source of content, and search for duplicates before posting. Learn more
community guidelines

correct answers 1 Correct answer

Explorer , Feb 19, 2021 Feb 19, 2021

Managed to work this out

Translate
Adobe
Explorer ,
Feb 19, 2021 Feb 19, 2021
LATEST

Managed to work this out

Translate
Report
Community guidelines
Be kind and respectful, give credit to the original source of content, and search for duplicates before posting. Learn more
community guidelines