Answered

This topic has been closed for replies.
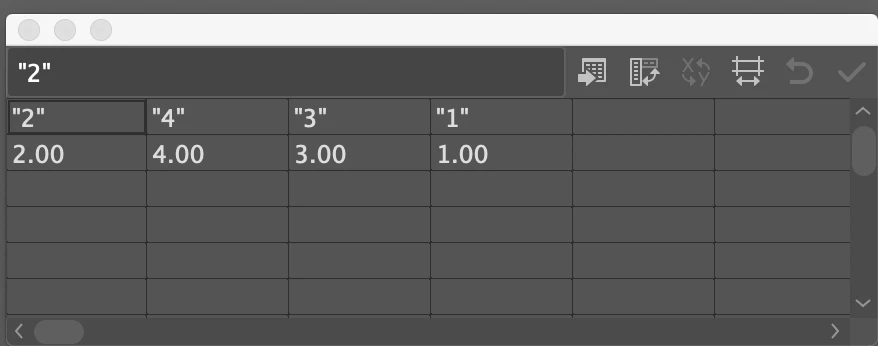
What @Myra Ferguson said is correct, but only part of the story. You must put the top row in quote marks as shown:
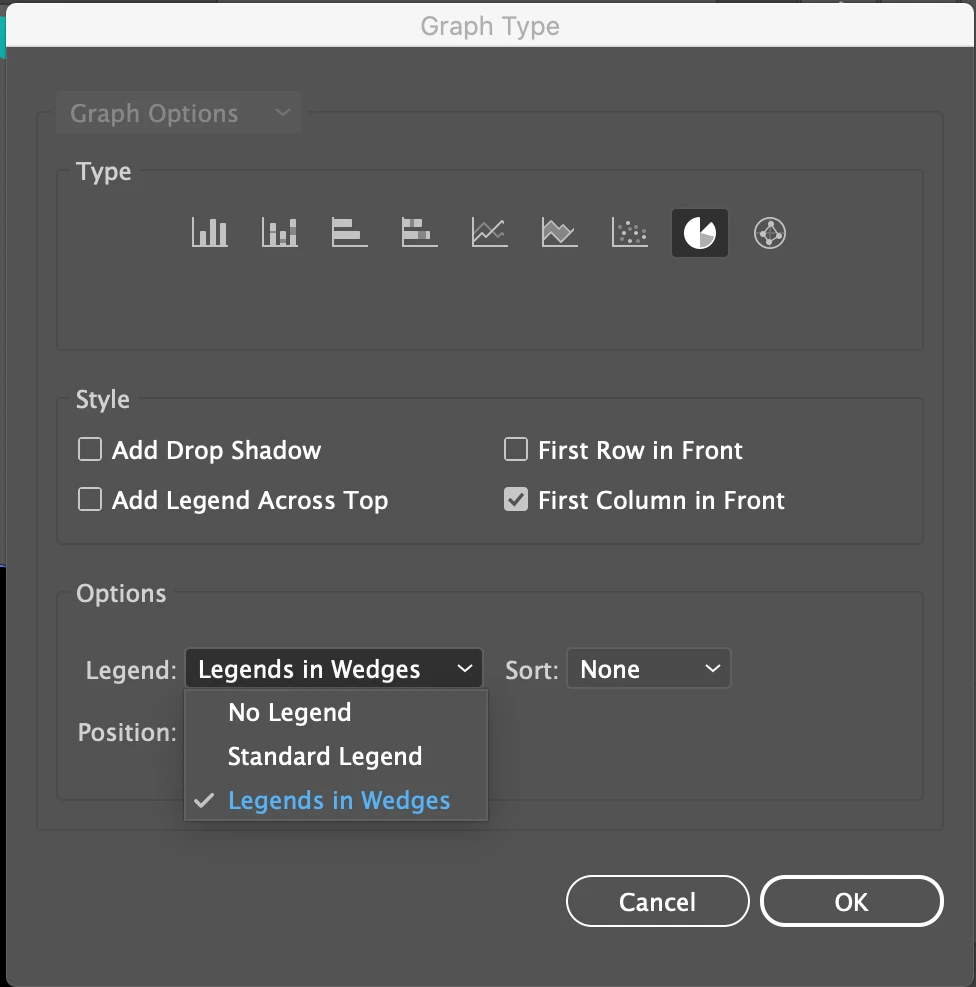
Then you need to double click on the graph tool to get the pop up menu, so that you can change the preference from Standard Legend to put it inside the wedge. Once you do that, you can change the size of the type of that number if you need to.
Sign up
Already have an account? Login
To post, reply, or follow discussions, please sign in with your Adobe ID.
Sign inSign in to Adobe Community
To post, reply, or follow discussions, please sign in with your Adobe ID.
Sign inEnter your E-mail address. We'll send you an e-mail with instructions to reset your password.