ParreLaws
New Participant
April 18, 2019
Question

Illustrator Stacked Bar Chart with Negative and Positive Numbers

  • April 18, 2019
  • 3 replies
  • 4636 views

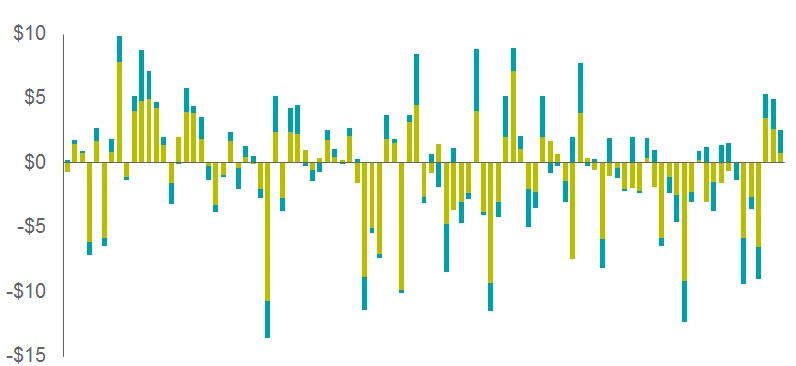
Is it possible to create a stacked bar chart with both negative and positive like the one below?

    3 replies

    New Participant
    September 8, 2020

    Hi there 
    i have solution for this 
    If you have Ilustrator 2020 or 2019 version you could modify the chart by this 

    1) Open illustrator with new file 
    Chose Collum graph tools 


    and draw a basic graph first 
    2) Double click again on the graph tool icon it will appear a pop up window name Graph Type 

    3) Then chose Graph Options --> Value Axis --> Tick on the Override Calculated Values 
    Now you have the Min and Max Values, you could put negative number at the Min box and Max is positive number 
    The Division box is the place you input how much Divisions for the graph 
    For ex: like the graph above :
    I will put like picture
    Min : -15
    Max :10
    Divisons : 5
    Then press OK you will have the result the graph will have both negative and positive units

    Known Participant
    June 19, 2019

    Frustrating that this can't be done. Not even like it's unreasonable.

    meganchi
    Brainiac
    June 19, 2019

    I know it seems frustrating, but that type of chart should probably be generated in something like excel because it requires computing and business tool type of software. Illustrator is a design program and therefore does not have robust charting capability.

    The work around is to do as @Monika Gause suggested, or you could draw a bunch of separate rectangles and color them individually to achieve your split chart colors.

    Inspiring
    November 20, 2023

    I have no problem holding Adobe accountable for delivering this functionality. Seems like a reasonable and anticipateable requirement of users creating stacked bar graphs. It's just degrees of existing capability, not asking them to write another Excel.

    meganchi
    Brainiac
    April 18, 2019

    Yes, when you use the chart tool, type a negative sign in front of your number and hit enter.

    ParreLaws
    ParreLawsAuthor
    New Participant
    April 18, 2019

    Thanks, but that does not solve my issue. The issue is some bar have both a negative for the teal part and positive for the lime part. This give me an error message that says "Can't crate the graph. Each stacked column must contain all positive or all negative data."

    Monika Gause
    Community Expert
    April 18, 2019

    You can't have a positive lime and a negative teal in one place. That's what the message says. Your example chart will work, but waht you actually want to do, won't.

    Put them into two separate charts and stack them. Or use a different app to create the charts and then style them in Illustrator. Simple bar charts should be exported as vector files from Excel.