Participating Frequently
February 7, 2015
Answered

More complex pie charts

  • February 7, 2015
  • 2 replies
  • 10998 views

Hi,
I'd like to create improved pie charts with effects like this without doing them by hand :

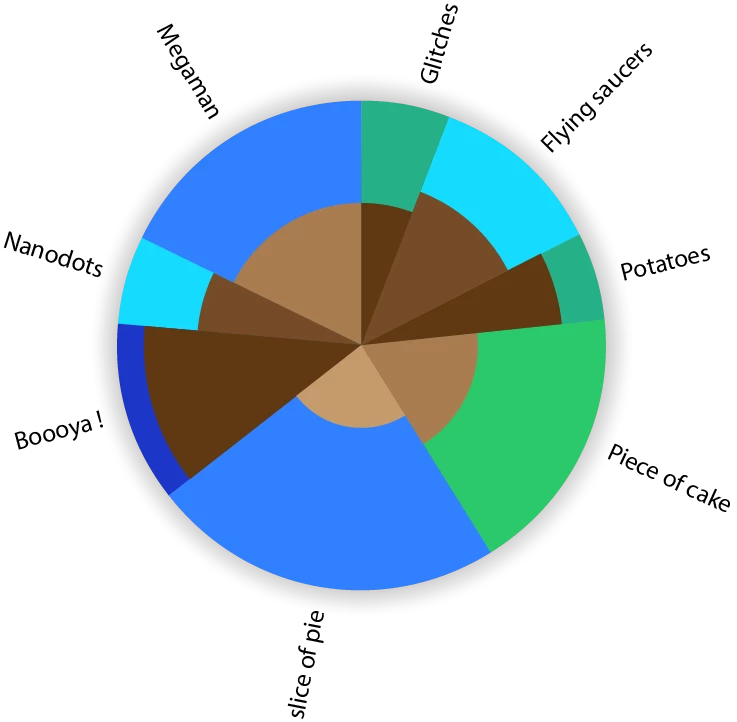
I'm bad at scripting in illustrator, but I'd like some effects like the slice's size variations and the text orientation.

This topic has been closed for replies.
Correct answer Qwertyfly___

Hi again,
I'm experiencing a bug with Pie maker 1.002.
With  the % box unchecked, if the first digit of the inner value is superior to the first digit of the outer value, the inner gets red and the OK button gets greyed out, even if the outer value is by far bigger. In the opposite situation, the inner stays black and the OK button works even if the inner value is way bigger.

This doesn't happen with version 1.

Is it the same for you ?


Thanks heaps for the feedback.

the issue, as far as I can make out is due to me comparing to strings, I have now passed them as floats so it should work now.

the new version can be downloaded from here:

QwertyFly.com

please let me know if you come across any other issues or bugs.

thanks again..

2 replies

Qwertyfly___
Legend
February 25, 2015

‌cheers, code needs a little cleaning up. But I was happy with the result.

CarlosCanto
Community Expert
Community Expert
February 26, 2015
code needs a little cleaning up

+ indenting...but other than that, I love it!! great work

Qwertyfly___
Legend
February 26, 2015

I was playing with ScripUI and put something together.

it's painful.

Whats with the ugly tabs?

also from what I understand I need to use bridgetalk to then get it to talk to illustrator.

this has me stumped.

I can get all the arrays and variables filled.

but then how do I target illustrator to start drawing the Pie?


Silly-V
Legend
February 7, 2015

I have a question: what's the dual colors of each pie slice represent? ex: for "piece of cake", what does the green and the brown mean?

tayzanoAuthor
Participating Frequently
February 8, 2015

Well in this case it doesn't matter, let's say the size of the slice means the quantity and the brown means their temperature. It can be anything. It's basically the same as this kind of bar chart which Illustrator already does :

Inspiring
February 28, 2015

for UI am thinking a way to fill out an array for outer segments

then another array for inner segments

and a final array for text labels.

an option for size/radius.

and an option for

   a)   inner segment to be a percentage of the overall radius

   b)   inner segment to be a percentage of area

styling is another thing, maybe leave that for later...

her is what I have so far.

give it a shot and let me know what you think...

var r = 100; //Radius

var angleArray = [4,2,6,5,1,2,5,1];

var divisions = 0;

for (var i = 0; i < angleArray.length; i++){

divisions += angleArray;}

var anglePerDivision = 360 /  divisions;

var Cx = 0 , Cy = 0; // Center of Pie

var Sx = 0 , Sy = 100; // Start Point on outer edge

var Ex , Ey; // End Point on outer edge

var SHx , SHy; //handle of Start Point

var EHx , EHy; //handle of End Point

var HL , HR , HA; //Handle Length, Radius, Angle

var acc = 0; //accumulative angle

var a = 0;

for (var i = 0; i < angleArray.length; i++){

a  = angleArray*anglePerDivision;

acc += a;

Ex = Math.sin(toRad(acc))*r;

Ey = Math.cos(toRad(acc))*r;

HL = HandleLength(a,r);

HR = HandleRadius(r,HL);

HA = HandleAngle(HR,HL);

SHx = Math.sin(toRad(acc-a)+HA)*HR;

SHy = Math.cos(toRad(acc-a)+HA)*HR;

EHx = Math.sin(toRad(acc)-HA)*HR;

EHy = Math.cos(toRad(acc)-HA)*HR;

DrawSector()

Sx = Ex;

Sy = Ey;

}

function DrawSector(){

var Sector = app.activeDocument.pathItems.add();

var pt;

pt = Sector.pathPoints.add();

pt.anchor = Array(Sx, Sy);

pt.leftDirection = Array(Sx, Sy);

pt.rightDirection = Array(SHx, SHy);

pt = Sector.pathPoints.add();

pt.anchor = Array(Ex, Ey);

pt.leftDirection = Array(EHx,EHy);

pt.rightDirection = Array(Ex, Ey);

pt = Sector.pathPoints.add();

pt.anchor = Array(Cx, Cy);

pt.leftDirection = Array(Cx, Cy);

pt.rightDirection = Array(Cx, Cy);

Sector.closed = true;

Sector.stroked = false;

Sector.filled = true;

Sector.selected = true;

redraw()

}

function toRad(angle){return angle*Math.PI/180;} //Convert Degrees into Radians

function HandleLength(angle,radius){return 4/3*Math.tan(toRad(angle)/4)*radius;} //Calculate Handle Lengh (Not accurate enough)

function HandleRadius(radius,hl){return Math.sqrt((radius*radius)+(hl*hl));} //Length of Hypotenuse, Distance of handle from Centre

function HandleAngle(hr,hl){return Math.asin(hl/hr);} //angle of the Hypotenuse, angle of handle from the anchor (answer in Radians)


Nice work ! (Wonder if the thread originator will ever return? ;-)


[Question:] Without evaluating the code too closely, what are the outer & inner input slice numbers based upon?


Like:

inputNum/totalNum*360% = arc%

Or:

inputNum/totalNum*100% = arc%

Or:

%*360=decimal*360 = arc%

Or:

decimal*360 = arc%

Etc:

Quick Assessments / Suggestions :

1.) Given the question above, in general I think it would perhaps be more applicable to allow the user to input percentage numbers verses decimals and re-factor the needed math internally in the code as needed allowing the user a simpler input. Or having an option based upon user preference: decimal or percentage.


2.) You may consider adding: "cir.stroked = false;" to your dropShadow function so it does not inadvertently apply the current stroke/color/size from the IDE when executed.


3.) You may also consider allowing a corresponding legend beside the chart, or simply appending the arc% numbers to the end of the text names.


----------


4.) As for the UI:


It could be as simple as input into "edittext" fields, then evaluating, verifying, parsing and passing the info.


Similarly, it could be as simple as using "File.openDialog" and bringing in raw data from a TXT file or CSV file and evaluating, verifying, parsing and passing the info. Or a combination of the two within the same simple UI.


Or of course it can be as complex as desired. ;-)


----------


Again, nice work.