• Global community
    • Language:
      • Deutsch
      • English
      • Español
      • Français
      • Português
  • 日本語コミュニティ
    Dedicated community for Japanese speakers
  • 한국 커뮤니티
    Dedicated community for Korean speakers
Exit
0

Scatter chart scaling is off

Community Beginner ,
Jan 19, 2018 Jan 19, 2018

Copy link to clipboard

Copied

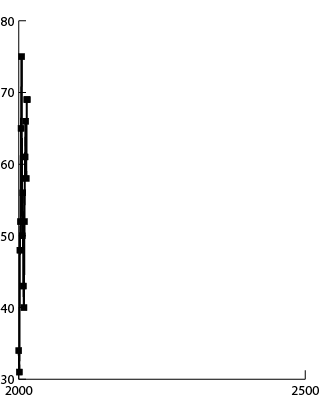
I'm trying to make a scatter chart showing data from the year 2000 to the year 2016. I have my data entered, but the x-axis is autogenerated to go from 2000 to 2500, so my data is all squished up against the y-axis (see picture). Is there an easy way to fix this?

Any help would be greatly appreciated!Drugs with at least 1 expedited program.png

Views

399

Translate

Translate

Report

Report
Community guidelines
Be kind and respectful, give credit to the original source of content, and search for duplicates before posting. Learn more
community guidelines

correct answers 1 Correct answer

Community Beginner , Jan 19, 2018 Jan 19, 2018

Figured it out - was in object --> graph --> graph type --> bottom axis

Votes

Translate

Translate
Adobe
Community Expert ,
Jan 19, 2018 Jan 19, 2018

Copy link to clipboard

Copied

Please post the name of the program you use so a Moderator may move this message

-A program would be Photoshop or Dreamweaver or Muse or InDesign or ???

Votes

Translate

Translate

Report

Report
Community guidelines
Be kind and respectful, give credit to the original source of content, and search for duplicates before posting. Learn more
community guidelines
Community Beginner ,
Jan 19, 2018 Jan 19, 2018

Copy link to clipboard

Copied

Whoops, forgot to mention - this is in illustrator.

Votes

Translate

Translate

Report

Report
Community guidelines
Be kind and respectful, give credit to the original source of content, and search for duplicates before posting. Learn more
community guidelines
Adobe Employee ,
Jan 19, 2018 Jan 19, 2018

Copy link to clipboard

Copied

Moving to Illustrator​

Votes

Translate

Translate

Report

Report
Community guidelines
Be kind and respectful, give credit to the original source of content, and search for duplicates before posting. Learn more
community guidelines
Community Expert ,
Jan 19, 2018 Jan 19, 2018

Copy link to clipboard

Copied

Put your years in quotes and try again.

Votes

Translate

Translate

Report

Report
Community guidelines
Be kind and respectful, give credit to the original source of content, and search for duplicates before posting. Learn more
community guidelines
Community Beginner ,
Jan 19, 2018 Jan 19, 2018

Copy link to clipboard

Copied

LATEST

Figured it out - was in object --> graph --> graph type --> bottom axis

Votes

Translate

Translate

Report

Report
Community guidelines
Be kind and respectful, give credit to the original source of content, and search for duplicates before posting. Learn more
community guidelines