• Global community
    • Language:
      • Deutsch
      • English
      • Español
      • Français
      • Português
  • 日本語コミュニティ
    Dedicated community for Japanese speakers
  • 한국 커뮤니티
    Dedicated community for Korean speakers
Exit
0

Trouble creating bar graphs with numerical categories

Explorer ,
Jun 09, 2019 Jun 09, 2019

Copy link to clipboard

Copied

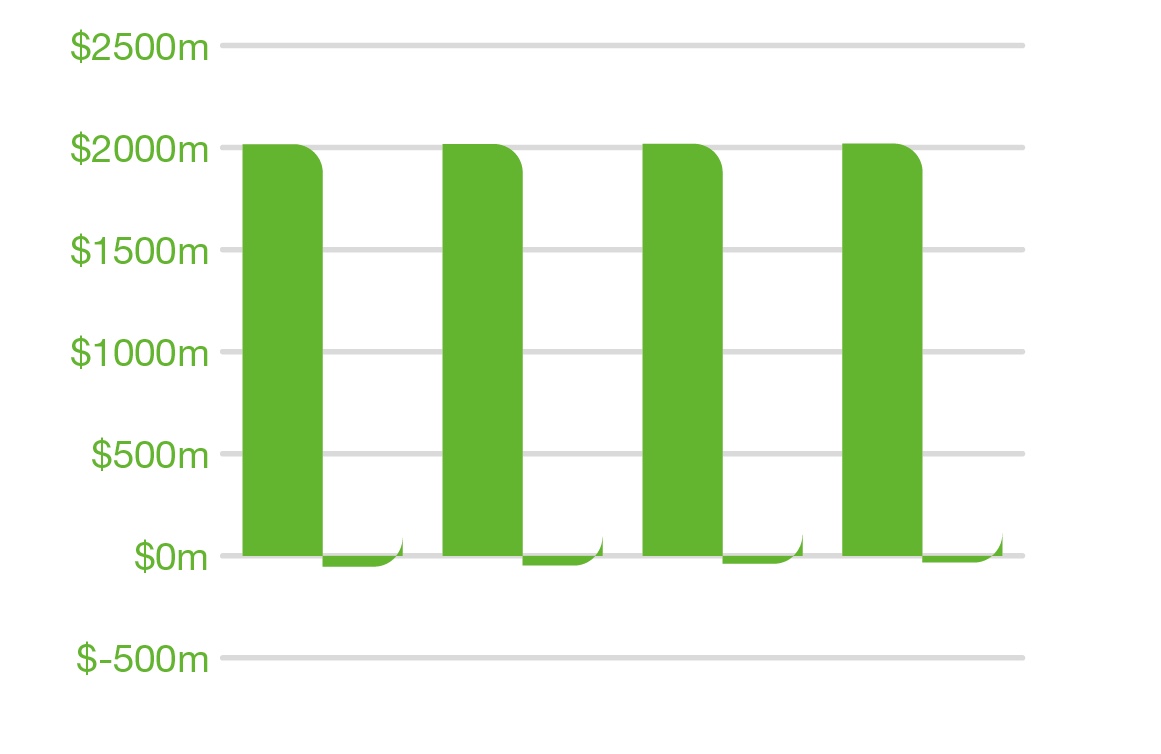
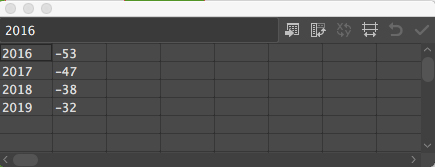
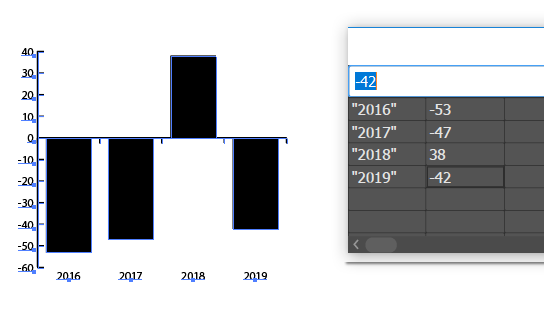
I'm trying to make bar graphs showing financial data over several years. However when I use "2019, 2018" etc as categories, Illustrator thinks I'm giving actual data and tries to map the numbers on the graph. I end up with two side-by-side columns, with blank category names.

Illustrator.jpeg

Data.jpg

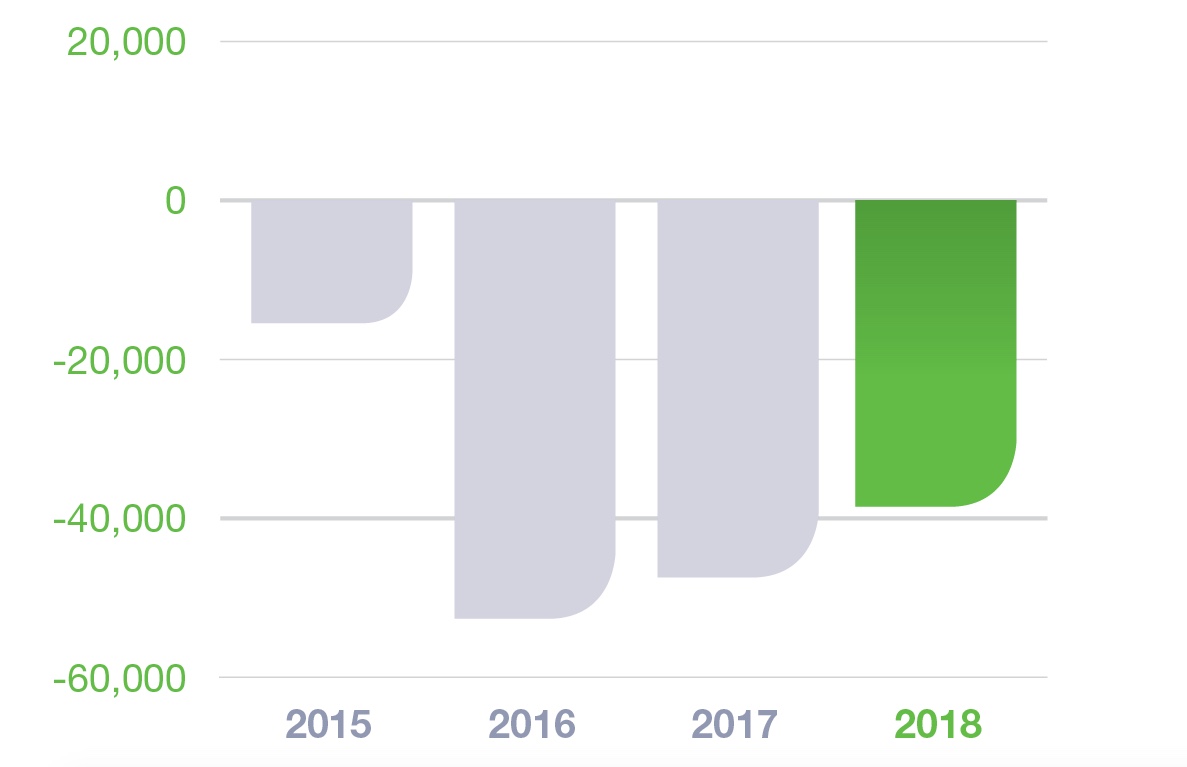
This what it's supposed to look like (manually created in InDesign using last year's data):

Indesign.jpeg

I'm on a tight deadline but would love to crack this puzzle! Any ideas how to get Illustrator to recognise these numbers as names?

Views

256

Translate

Translate

Report

Report
Community guidelines
Be kind and respectful, give credit to the original source of content, and search for duplicates before posting. Learn more
community guidelines

correct answers 1 Correct answer

Community Expert , Jun 10, 2019 Jun 10, 2019

enclose your years in quotes

chartLabels.PNG

Votes

Translate

Translate
Adobe
Community Expert ,
Jun 10, 2019 Jun 10, 2019

Copy link to clipboard

Copied

enclose your years in quotes

chartLabels.PNG

Votes

Translate

Translate

Report

Report
Community guidelines
Be kind and respectful, give credit to the original source of content, and search for duplicates before posting. Learn more
community guidelines
Explorer ,
Jun 10, 2019 Jun 10, 2019

Copy link to clipboard

Copied

LATEST

Perfect thank you!!

Votes

Translate

Translate

Report

Report
Community guidelines
Be kind and respectful, give credit to the original source of content, and search for duplicates before posting. Learn more
community guidelines