

- Home
- Illustrator
- Discussions
- Re: Use of Data Set to translate text in illustrat...
- Re: Use of Data Set to translate text in illustrat...
Use of Data Set to translate text in illustrator files?

Copy link to clipboard
Copied
Hello,
I'm trying to figure out on what would be the best strategy on the usage of data set to translate our product packaging. It's quite complex as we have several languages on the same packaging. Moreover, we have different text sources that would require to be translated in different sets of languages.
I have already looked into the data set and I tried to get familiar with it. I'm just wondering if someone had a good idea on how to create the data set and how to name the different variables knowing that there are different source texts for a particular region (region means a set of languages) and other texts for another region... The idea is to export this into one XML file with well identified elements that can be split with a tool, sent for translation according to their region then merged back into one single file to be imported back into illustrator
Region 1:
en-US
text 1
text 2
fr-FR
text 1
text 2
de-DE
etc...
Region 2:
en-US
text 3
text 4
ru-RU
text 3
text 4
Region 3:
etc..
It seems that the formatting such as bold, italic and so on is not exported into the data set which is quite embarrassing. Any suggestions
I hope someone will be able to give me some help...


Explore related tutorials & articles
 11
Replies
11
11
Replies
11

Copy link to clipboard
Copied
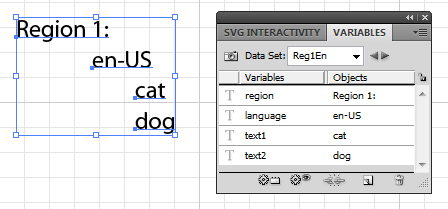
set it up as shown below, for your sample use 4 vairables, one for the Region, one for the language and two for the the text items. 2 regions, 3 sets of languages each, yields 6 Datasets.

keskifo wrote:
It seems that the formatting such as bold, italic and so on is not exported into the data set which is quite embarrassing.
the Data Set is just that...data. Format your text holder as desired, it won't change when you change data sets.
Copy link to clipboard
Copied
My formatting changes when I cycle through my data sets. Do you know what I'm doing wrong?
STB
Copy link to clipboard
Copied
no, I don't know what's wrong, it shouldn't change.
what's changing?
Copy link to clipboard
Copied
The tracking changes.

Copy link to clipboard
Copied
Please, show it to us
Copy link to clipboard
Copied
You'll need to see the illustrator file and the variables file to see how it changes the tracking. Can I email both to you?
Copy link to clipboard
Copied
you can upload the file to server and post a link to it here, you could also post screen shots showing you variables, layers, character, and or other relevant panel open.
Copy link to clipboard
Copied
Here is the zip file containing both the variables file and the illustrator file:
Copy link to clipboard
Copied
I see two datasets, changing from CaseWare to Le CaseWare. I don't see tracking changes. Please elaborate.

Copy link to clipboard
Copied
keskifo:
I'm especially interested in the export of the format (bold, italic, etc.). Did you ever figure out how to do that?
"It seems that the formatting such as bold, italic and so on is not exported into the data set which is quite embarrassing."
Carlos:
"the Data Set is just that...data. Format your text holder as desired, it won't change when you change data sets."
Thanks
Beate

Copy link to clipboard
Copied
Unfortunately, it looks like the entire text body gets the style of what I assume to be is the last character in the body. There are ways to work around this issue though, by using some scripting. One method is to use cumbersome arbitrary style tags in the data to be interpreted by a script which will be ran during export after data is populated. For example if the data is "<bold>cats</bold> and <italic>dogs</italic>", you could have a script process that text after it's populated by parsing it, removing the tags, applying the styling you want, etc. This is not great by any means. A more advanced way could be to use an "intermediary data layer" which is to say, you have a layer or group that can be hidden completely, with all of your variable text in different text boxes. Then you have your 'real' text which can have styled placeholders and use a script to replace the text in the textRanges so that the styling persists.
For example, in the hidden layer you have text boxes assigned to various variables and after population would look like this:
cats
dogs
And in your actual visible text you have one text frame which reads:
<<animal_1>> and <<animal_2>>
After the data is populated, the processing script will create this:
cats and dogs
Just to add extra redundancy to my comment here, I'm going to insert a link to my LinkedIn post which uses the intermediary data layer technique.

Find more inspiration, events, and resources on the new Adobe Community
Explore Now
 AdChoices