elektrik309
Participating Frequently
January 4, 2017
Answered

How to wrap a bar chart around a circle?

  • January 4, 2017
  • 2 replies
  • 11001 views

Hi all,

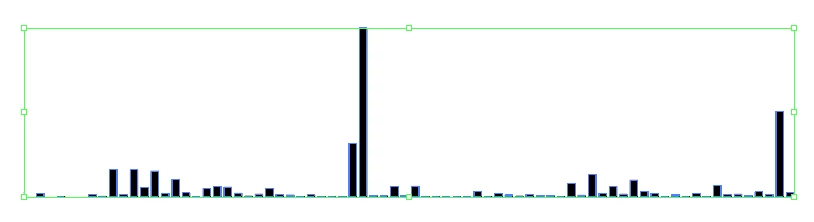
In the process of creating an infographic, I'd like to create a bar chart that gets properly circularized. I've created it with the chart tool, removed everything but the bars and grouped it:

Then I created it as a new art brush, and applied it to a circle:

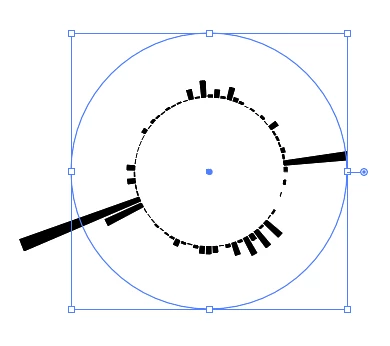
But the bars are warped and it's not on the path of the circle. I end up expanding the circle to size it, rather than having it on that precise path. And when I adjust the stroke size of the circle, the inner diameter and bar height really change, further distorting the shape.

How can I take the original chart and just arrange it around the circle without changing the shapes of the bars?

Many thanks in advance!

This topic has been closed for replies.
Correct answer Jacob Bugge

Matt,

Sorry, I spotted a serious error in 3) in the description in post #2:

Here is an amended version (the other steps are unchanged):

1) Copy the first bar so it appears at the right distance after the last bar (the same distance as between all the bars) so you have that as a double, then Ctrl/Cmd+G to Group the bars;

2) Ctrl/Cmd+C+F to create a copy of the bar group, then Object>Transform>Reflect with Axis Horizontal, then deselect and ShiftClickDrag by one of the top corners to snap to the corresponding bottom corner of the original bar group, then remove the Fill from the copy so it becomes invisible;

3) Ungroup the original and the copy, then Group each pair of bars to form a double bar (symmetrical over/under the bar base, visible/invisible);

Now comes the one step Blend fake:

4) Object>Blend>Options>Specified steps, set the value to 1 and set Orientation to Align to Path;

5) Select all the objects and Object>Blend>Make (now you have intermediate shapes between the objects, but not for long);

6) Create/Select the circle and cut it where you wish the first/last bar (which will be on top of each other;

7) Select the Blend from 5) and the circle from 6) and Object>Blend>Replace Spine;

8) Object>Blend>Release;

9) Click on the first/last bar and press Delete.

This should leave you with the undistorted bars in place round and outside the circle.

2 replies

Jacob Bugge
Community Expert
Community Expert
January 4, 2017

elektrik,

I believe you can do it without too much work, just using the inherent tools and ways, starting (over) from the ungrouped bars, Smart Guides being your friends:

1) Copy the first bar so it appears at the right distance after the last bar (the same distance as between all the bars) so you have that as a double, then Ctrl/Cmd+G to Group the bars;

2) Ctrl/Cmd+C+F to create a copy of the bar group, then Object>Transform>Reflect with Axis Horizontal, then deselect and ShiftClickDrag by one of the top corners to snap to the corresponding bottom corner of the original bar group, then remove the Fill from the copy so it becomes invisible;

3) Group the original and the copy;

Now comes the one step Blend fake:

4) Object>Blend>Options>Specified steps, set the value to 1 and set Orientation to Align to Path;

5) Select all the objects and Object>Blend>Make (now you have intermediate shapes between the objects, but not for long);

6) Create/Select the circle and cut it where you wish the first/last bar (which will be on top of each other;

7) Select the Blend from 5) and the circle from 6) and Object>Blend>Replace Spine;

8) Object>Blend>Release;

9) Click on the first/last bar and press Delete.

This should leave you with the undistorted bars in place round and outside the circle.

elektrik309
Participating Frequently
January 5, 2017

Hi Jacob,

Thanks so much for the detailed and thoughtful response -- I appreciate it. I haven't been able to get there and I'm hoping you may know what I'm missing.

After step 6, I'm left with the blended chart and my cut circle (I cut it at the 3 o'clock position):

But then when I apply step 7 and Replace Spine, I end up with this:

What am I missing? I'm not sure what that chart has become (it un-reflected the invisible copy?) but it's definitely not the goal . Any thoughts would be much appreciated.

Thanks again,

Matt

Jacob Bugge
Community Expert
Community Expert
January 5, 2017

Thanks again, Jacob. I must be doing something wrong. When I do the blend, I get some wacky bars and a very odd result. After the blend:

Then after cutting the circle and replacing the spine:

I wonder if I'm creating the bar chart incorrectly? In the examples above, I deleted everything but the bars - axis marks, separators, even the paths around the bars. When I just create a new chart and only erase the X-axis, labels and Y axis, then do the steps again, I get this:

So that's closer to the end result, but it has all the X axis tick marks on the right side and doesn't loop the first bar back around to the duplicated last bar (I've coloured that bar red). Is there a better/different way I should be working with the chart? I just did a simple bar, pasted the data from Excel, then used Object > Flatten Transparency and then Ungroup.

Thanks again for your help! I really appreciate it!


Matt,


Here is a screenshot with everything selected of certain steps on the way with a crude/simplified version (just 8 (+1) bars corresponding to 45 degrees between them on a circle), all done exactly as described:


The first one shows the set of bar pairs after step 3);

The second one shows the 1 step fake blend after step 5);

The third one shows the circle cut at the top;

The fourth one shows the blend with the circle as the spine (the unseletcable ones are the the 1 steps between the others) after step 7;

The fifth one shows the final bars after releasing the blend (the selected ones in the fourth one) after step 😎 which looks like the final result after step 9 because the last bar pair is on top of the first one.


As you can see they all behave, and they are spread evenly round the circle at every 45 degrees, starting/ending at the top.


You may try to compare this to your results at the corresponding steps.


Click Here to see in Chrome 

Monika Gause
Community Expert
Community Expert
January 4, 2017

You would need to create it that way.

Maybe try something like: https://d3js.org/