 Adobe Community
- Home
- Lightroom Classic
- Discussions
- Re: Interactive debugger for Lightroom plugins
- Re: Interactive debugger for Lightroom plugins
Interactive debugger for Lightroom plugins

Copy link to clipboard
Copied
The Lua IDE "ZeroBrane" now supports interactive debugging of Lightroom plugins. This means you can set breakpoints, step through your code line by line, examine/watch your variables as you do so etc. It can be quite helpful when debugging a complex situation in a plugin, and I don't think it was previously available.
For more details see here,
http://notebook.kulchenko.com/zerobrane/debugging-lightroom-plugins-zerobrane-studio-ide
See the last screenshot for a view of the interactive debugger.
(Disclaimer: I am not affiliated with them but have worked a little with their software, and like it. Paul, the developer, is very responsive and helpful, in case you should still encounter the occasional quirk.)


 9
Replies
9
9
Replies
9

Copy link to clipboard
Copied
Very interesting, thanks!

Copy link to clipboard
Copied
That looks very interesting indeed. However, I wasn't able to get that up and running in LR5.6 / Mac.
I changed the minor version to 6, copied the file to the location where it's supposed to be, started the Debugger server, and included local LrMobdebug = import 'LrMobdebug'
However, when calling Lrmobdebug.start(), execution of my script does not seem to execute anymore. Any idea what I should check?
Best regards
Klaus
Copy link to clipboard
Copied
I just tried it in Lightroom 5.6/Mac, and it worked well. (I don't have the latest version of ZBS installed, however.)
The only thing I see is that if you import it as local LrMobdebug, it should be "LrMobdebug.start()", not Lrmobdebug.start(), i .e. upper/lower case 'm'. (turns out this is wrong in the article too). However, LR should inform you of this when you start the plugin, with the error message "An internal error has occurred - attempt to index global Lrmobdebug (a nil value). So maybe you have caught this already.
The only real suggestion I have is to restart Lightroom, as that sometimes helps. Otherwise, I followed the steps in the article, i.e. script opened in ZBS, project directory set etc. I did not set a breakpoint as Lrmobdebug.start() already breaks itself.
Copy link to clipboard
Copied
DonCristobal wrote:
The only thing I see is that if you import it as local LrMobdebug, it should be "LrMobdebug.start()", not Lrmobdebug.start(), i .e. upper/lower case 'm'. (turns out this is wrong in the article too). However, LR should inform you of this when you start the plugin, with the error message "An internal error has occurred - attempt to index global Lrmobdebug (a nil value).
This was it. Actually the lowercase m does NOT throw any error, but simply stops execution.
Thanks!
Klaus

Copy link to clipboard
Copied
Completely new in Lua and LR scripting, I encounter problems also. I changed inside Info.lua the major/minor version as described in Debugging Adobe Lightroom plugins with ZeroBrane Studio, but it took me a while to find the correct one (too many values in Lightroom system info). In case of eg 2015.1.1 is: major:6 minor:1 revision:1. Works ok.

Copy link to clipboard
Copied
Hi all,
If you know could you tell me how to specify version info for Lightroom CC 2015.12 Release (Camera Raw 9.12)?
Help: System Info shows as following
===
Lightroom version: CC 2015.12 [ 1125239 ]
License: Creative Cloud
Operating system: Windows 7
Version: 6.1
===
So I specified version information in Info.lua file as following, but it seems not working.
===
VERSION = { major=6, minor=1, revision=0, build=1125239 }
===
I tried not modified build number from default, but it seems not working too.
===
VERSION = { major=6, minor=1, revision=0, build=200000 }
===
From stamatiad 's post, 2015.1.1 is 6.1.1.
So I think CC 2015.12 is higher version number, but I'm not sure where to check.
Thank you,
Naoki
Copy link to clipboard
Copied

Copy link to clipboard
Copied
Hi Naoki-Hada
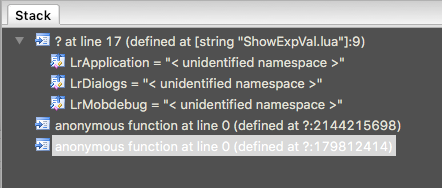
Thanks for the version number tip. With this I was able to get the Zerobrane IDE to debug the test plugin as shown on the zerobrane page. (see image)
However, the 'stack' panel shows "< unidentified namespace >" and the 'watch' window is empty.
Does it work correctly for you and show the values you would expect to see?
B
Copy link to clipboard
Copied
I think Stack is showing as expected.
Watch can be added by manually typing or right click on valuable.
I think ZeroBrane Studio does not have object browser kind functionality as similar to Chrome debugger or ESTK (ExtendScript Toolkit).
I hope I'm wrong this part.
Thank you,
Naoki

 AdChoices