

- Home
- Lightroom Classic
- Discussions
- Re: [Q] Development tool recomendation?
- Re: [Q] Development tool recomendation?

Copy link to clipboard
Copied
Hi all,
I'm not sure what is good development tool for Lighroom plugin development.
Any recommendation?
I've tried following.
* WebStorm
I used for CEP plugin development for JavaScript and ExtendScript.
Code look up is strong and capable for Lua code
* ZeroBrane Studio
From other thread: Interactive debugger for Lightroom plugins
It has runtime debugging with steps and watch list.
But I think it does not have object browser like Chrome debugger or ESTK.
Is there any tool or good way to check object's data structure?
Thank you,
Naoki


 1 Correct answer

Try my Debugging Toolkit: Debugging Toolkit for Lightroom SDK . It's a rudimentary debugger, but it has the basics of breakpoints, stepping, and examining stacks, but it also can print out all Lua values, including nested tables, in a very readable format. Also, it handles the unique issues of Lightroom tasks, pcall, and error handling better than ZeroBrane.
 23
Replies
23
23
Replies
23
Copy link to clipboard
Copied
Try my Debugging Toolkit: Debugging Toolkit for Lightroom SDK . It's a rudimentary debugger, but it has the basics of breakpoints, stepping, and examining stacks, but it also can print out all Lua values, including nested tables, in a very readable format. Also, it handles the unique issues of Lightroom tasks, pcall, and error handling better than ZeroBrane.
Copy link to clipboard
Copied
johnrellis Thank you very much for the tool and the info.
I had installed the plugin already but not really tried yet.
# I was not sure how to use.
So I'll check more details.
Thank you,
Naoki
Copy link to clipboard
Copied
Check out the documentation in the file "Debugging Toolkit.html". It does take some time to get up to speed and prepare your source files, but that's due to inherent limitations of the Lua environment in LR with regard to error handling.
Copy link to clipboard
Copied
johnrellis Ah, I missed the documentation. It is helpful.
Thank you very much.
Copy link to clipboard
Copied
johnrellis I'm still trying to set up your Debugging Toolkit.
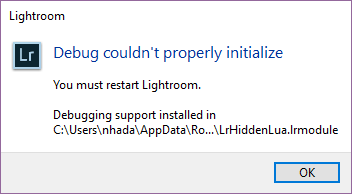
But I'm getting attached error.
Is it compatible for Lightroom Classic CC (ver 7.0)?
I'm not sure if I've seen this with Lightroom CC 2015.
I needed to upgrade Win 7 to Win 10.

Copy link to clipboard
Copied
It should work after you restart LR.
Like the ZeroBane debugger, the toolkit needs to install an undocumented module to get access to Lua's debugging facilities. But the toolkit does it automatically, and when it does, you need to restart LR for it to work.
Copy link to clipboard
Copied
I restarted Lightroom many times, but it is poping up every time.
It shows result, but it does not show debugger screen.
I'm trying to use Debug Script Command feature by following steps.
# I'd like to check object/data browser.
1) Removed all module folder/files from below
C:\Program Files\Adobe\Adobe Lightroom Classic CC\Modules
ZeroBrane code has removed as well.
2) Disable all modules except Debugging Toolkit
It is at following location
C:\Users\nhada\AppData\Roaming\Adobe\Lightroom\Modules\debuggingtoolkit.lrdevplugin
3) Re-launch Lightroom
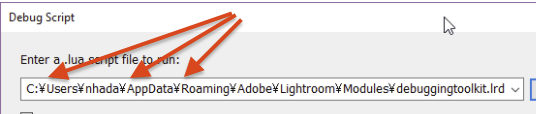
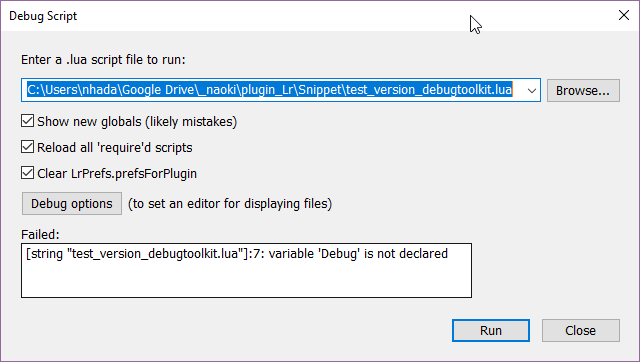
4) File > Plug-in Extras > Debug Script
Then following pop up. Even relaunched Lightroom, it shows every time.
I verified following folder has created with Info.lua and LrHidenLua.lua file.
C:\Users\nhada\AppData\Roaming\Adobe\Lightroom\Modules\LrHiddenLua.lrmodule
5) Select Test002.lua on Debug Script window then click "Run"
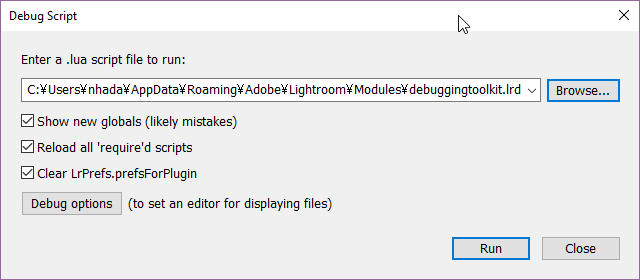
Test002.lua files is located in 2)'s folder.
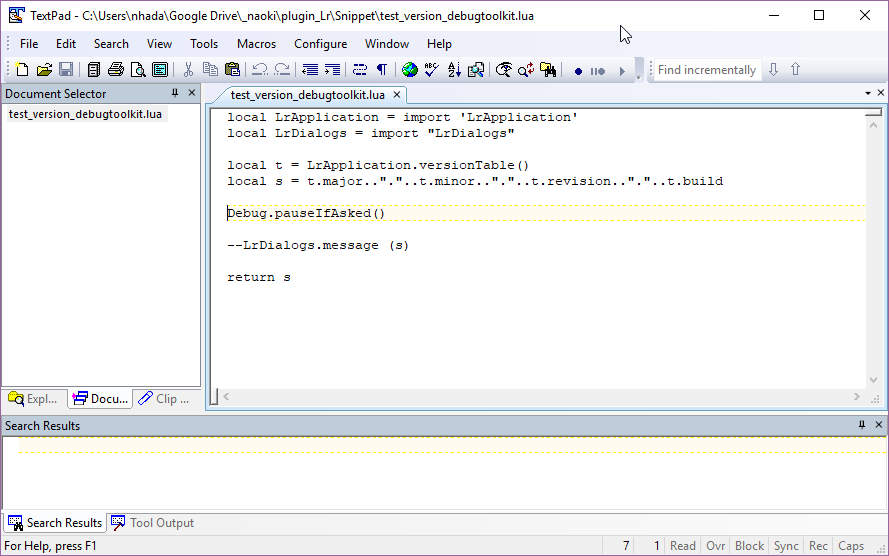
File content is following
| Test000.lua |
|---|
local LrApplication = import 'LrApplication' local t = LrApplication.versionTable() local s = t.major.."."..t.minor.."."..t.revision.."."..t.build return s |
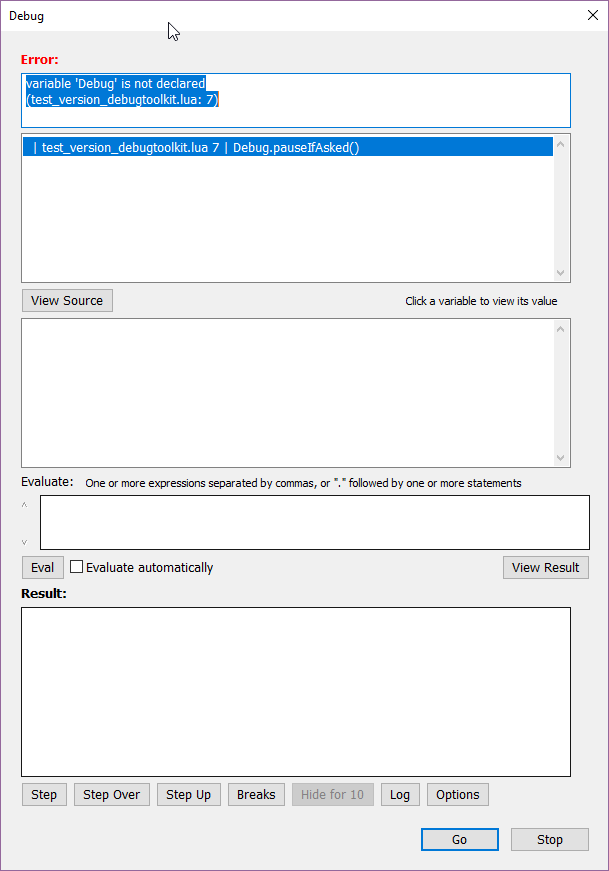
6) Then error shows up again.

7) After that 5)'s window pop up with result.
8) If I click "Run" again, it repeat from 6).
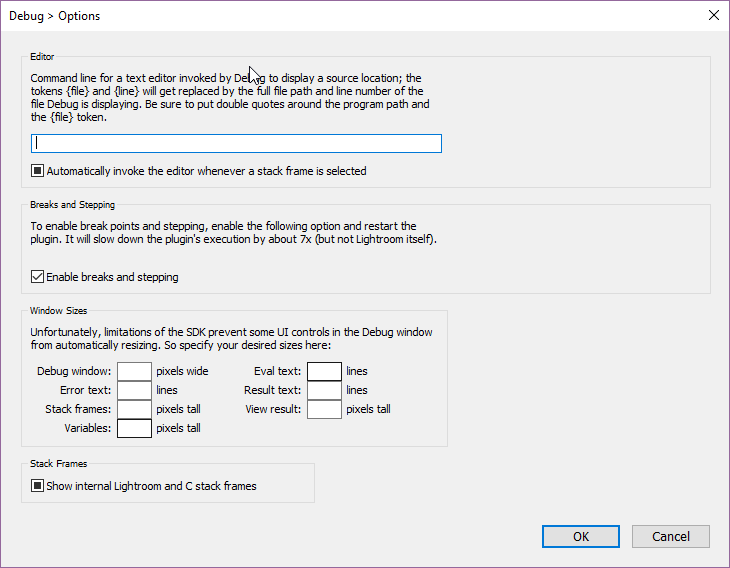
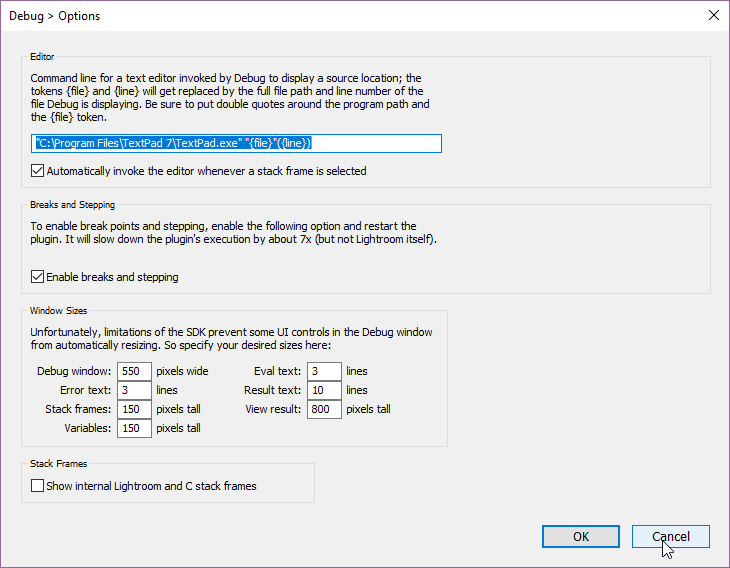
TextPad is installed following location, but it seems not called.
C:\Program Files\TextPad 7
C:\Program Files\TextPad 8
If there's something missing, please let me know.
Thank you,
Naoki
Copy link to clipboard
Copied
Very strange. Could you please zip up C:\Users\nhada\AppData\Roaming\Adobe\Lightroom\Modules\LrHiddenLua.lrmodule and email it to me at the support address on this page: Debugging Toolkit for Lightroom SDK
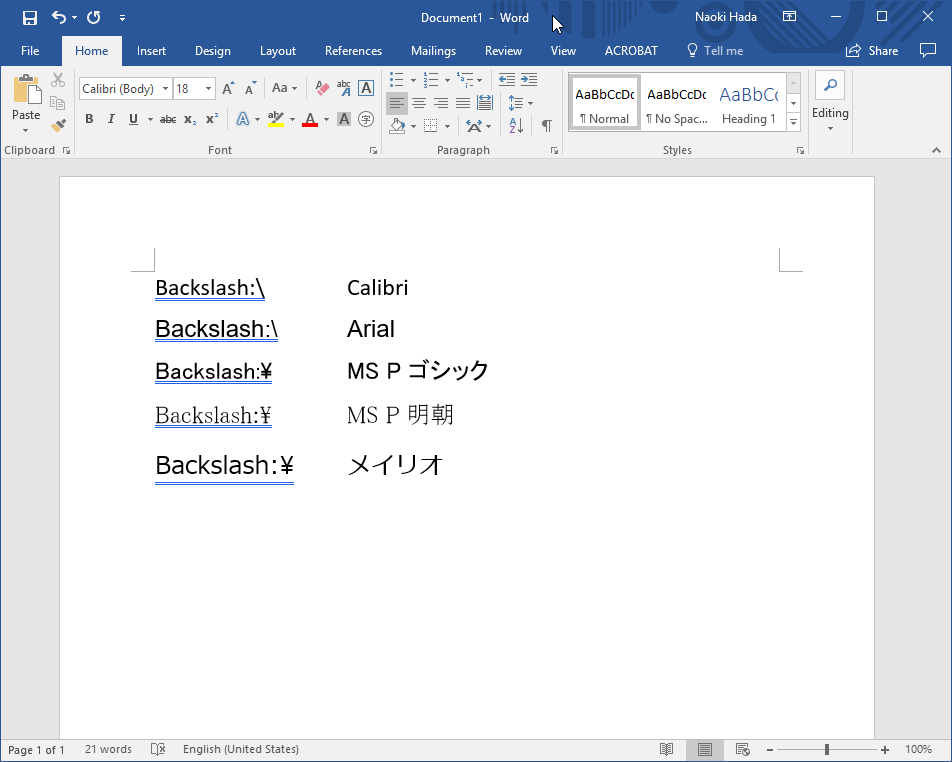
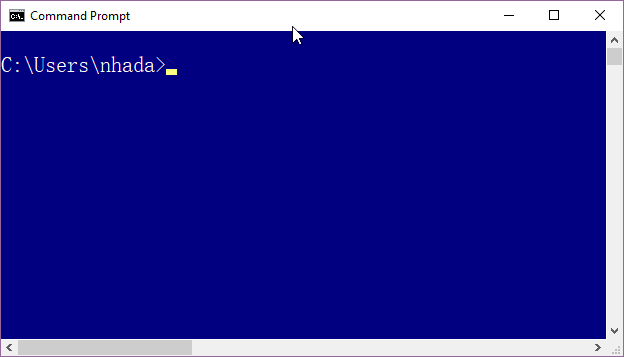
Also, your screenshot is concerning:
I wonder why the backslashes "\" not displaying properly? In which language is your LR running?
Copy link to clipboard
Copied
I've sent I've sent zipped LrHidadenLua.lrmodule and emailed.
If it is not delivered, please let me know.
# I might have typo on address.
Debugging Toolkit itself is 1.7.0
VERSION = {major = 1 , minor = 7, revision = 0, build = 0}}
> I wonder why the backslashes "\" not displaying properly? In which language is your LR running?
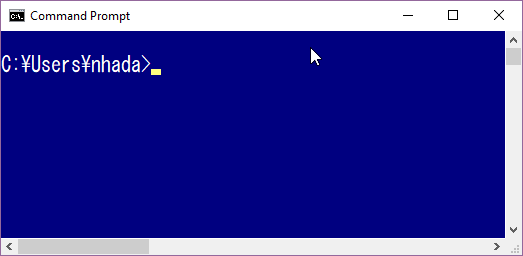
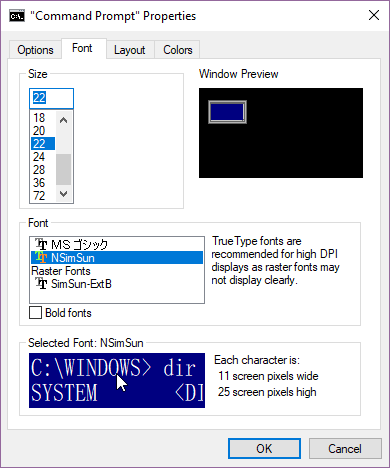
This part is no issue. The Windows' system locale has set to Japanese.
Back slash shows Japanese Yen mark in Japanese font set.
I don't know why, but it is from DOS era or even before.
Thank you,
Naoki
Copy link to clipboard
Copied
> I wonder why the backslashes "\" not displaying properly? In which language is your LR running?
This part is no issue. The Windows' system locale has set to Japanese. Back slash shows Japanese Yen mark in Japanese font set. I don't know why, but it is from DOS era or even before.
This makes me mildly suspicious. LR uses Unicode internally to represent and display all strings. It shouldn't be displaying the Yen symbol for "\", regardless of what's set for the Windows' system locale. I'm wondering if there's something going on internally with file paths causing LR to be unable to load LrHiddenLua.lua.
Copy link to clipboard
Copied
The string data are same.
Only glyph (each char in font set) is different.

Copy link to clipboard
Copied
The string data are same. Only glyph (each char in font set) is different.
Thanks, that clarifies the Yen mark. I do find it curious that LR would use a font in which the Unicode character for "\" displays as a Yen mark. The whole idea of Unicode is that a Unicode character is always displayed faithfully. There's probably a good reason, but not likely related to the Debug.lua problem.
In the next day or so, I'll set up a virtual machine with Windows 10 configured with the Japanese locale and see if I can reproduce your issue.
Copy link to clipboard
Copied
Here's a quick diagnostic that might help. Place the following into the file "test-import.lua":
local LrDialogs = import "LrDialogs"
local success, value = pcall (import, "LrHiddenLua")
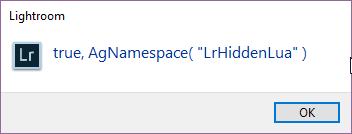
LrDialogs.message (tostring (success) .. ", " .. tostring (value))
In LR, click on the Scripts menu:

and select Open User Scripts Folder. Copy "test-import.lua" into that folder and restart LR. Then click the Scripts menu again and invoke "test-import". Post a screenshot of the result. Thanks.
Copy link to clipboard
Copied
I changed Windows' system locale from Japanese to English.
But the issue did not resolved.
I'm not sure if Lr Window has the script menu feature. There's no similar icon.
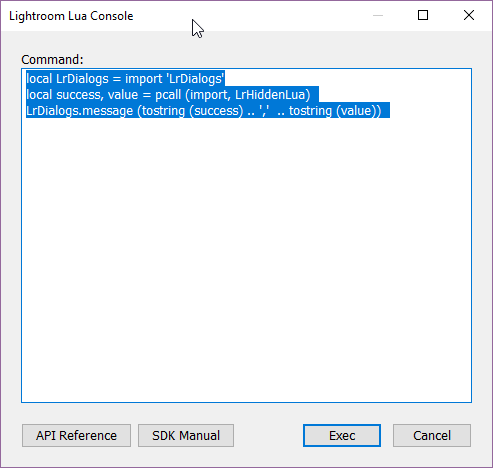
So I used Lua Console Lightroom Plugin from
GitHub - nitoyon/lua-console-lightroom-plugin: "Lua Console" plugin for Lightroom 3.0+
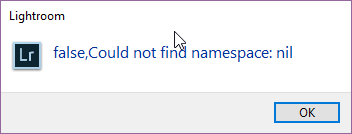
I'm not sure the result would be same as your instruction, but it shows failed.

Copy link to clipboard
Copied
I changed Windows' system locale from Japanese to English. But the issue did not resolved.
That's helpful to know, thanks.
Copy link to clipboard
Copied
I'm not sure if Lr Window has the script menu feature. There's no similar icon.
Oh sorry, I forgot that the Scripts menu only shows up if you've first created the folder. For future reference, see this help article for where to create the folder: Script to extract previews of lost or deleted photos
Copy link to clipboard
Copied
Thank you for the Script info.
I did not know this feature. It would be helpful for some case.
Following is screenshot run from Scripts folder.
The error message is different.
Copy link to clipboard
Copied
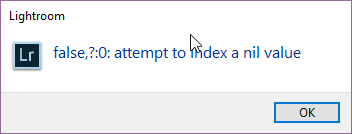
Well, that explains why the debugger can't initialize -- it can't load the LrHiddenLua module. The error message "attempt to index a nil value" must be coming internally from within LR, since LrHiddlenLua.lua doesn't do any indexing (the use of "." or [ ]). Unfortunately, ZeroBrane and the Debugging Toolkit rely on the same undocumented mechanism, and Adobe no longer provides any real support for the SDK, so we might be stuck here. I don't know why this happens with the toolkit but not with ZeroBrane.
I only have suggestion: Modify LrHiddenLua.lua to to look like this:
return {
-- _G = _G,
-- collectgarbage = collectgarbage,
coroutine = coroutine,
debug = debug,
-- gcinfo = gcinfo,
getfenv = getfenv,
-- module = module,
-- newproxy = newproxy,
-- os = os,
-- package = package,
setfenv = setfenv,
-- xpcall = xpcall}
That's the bare minimum required by the toolkit -- the other lines I added just for completeness, not because they were necessary.
My guess is that won't make a difference. Without being able to reproduce this myself on my Windows configuration, I think we'll just have to give up :-<
Copy link to clipboard
Copied
I tried, but it has same error.
Thank you,
Naoki

Copy link to clipboard
Copied
I'm afraid I'm out of options. The debugger works in my MacOS and Windows 10 LR 7, and I haven't received any reports about this before. There's clearly something different about your configuration but don't have any effective means to debug LR internals to figure out what.
Copy link to clipboard
Copied
One more thing occurred to me 😆 Try copying the folder "LrHiddenLua.lrmodule" from
C:\Users\nhada\AppData\Roaming\Adobe\Lightroom\Modules
to:
C:\Program Files\Adobe\Adobe Lightroom Classic CC\Modules
and remove any other files (e.g. the ZeroBrane files) from both of those folders. (In my testing, putting LrHJiddenLua in either of those folders works, with or without the ZeroBrane files, but who knows...)
Copy link to clipboard
Copied
Thank you very much for your support.
I think it is working now after reinstalled Lighroom.
One note is Lightroom Classic CC has updated to 7.0.1 .
For someone's benefit, following would be recovery steps as last resort.
Note: replace "nhada" to your user name
1) Back up user script/modules data. It could be following location.
C:\Users\nhada\AppData\Roaming\Adobe\Lightroom\Scripts
C:\Program Files\Adobe\Adobe Lightroom Classic CC\Modules
C:\Users\nhada\AppData\Roaming\Adobe\Lightroom\Modules
2) Uninstall all Lightroom(s) versions with removing preferences.
I uninstalled Lr Classic CC and Lr (new) CC as well
3) Remove left over files from following folders
C:\Program Files\Adobe\Adobe Lightroom Classic CC\
C:\Program Files\Adobe\Adobe Lightroom CC\
C:\Users\nhada\AppData\Roaming\Adobe\Lightroom\
4) Install Lightroom Classic CC
5) Disable all plug-ins from Menu: File->Plug-in Manager
6) Install Debugging Tool Kit to folder
C:\Users\nhada\AppData\Roaming\Adobe\Lightroom\Modules
And enable Menu: File->Plug-in Manager
And run once at Menu: File->Plug-in Extras -> Debugging Toolkit -> Debug Script
Then it pop up prompt dialog to restart Lightroom
7) Restart Lightroom
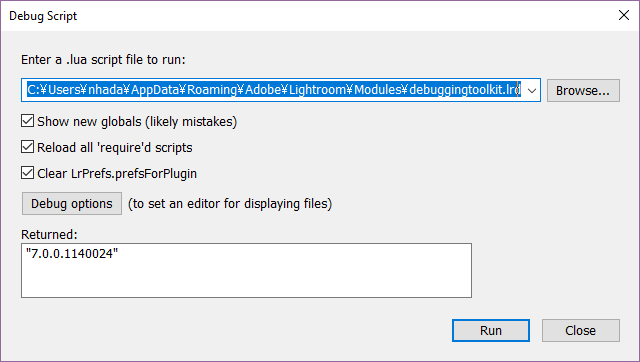
Then I think Debugging Toolkit is working as expected as following screenshot.
Thank you very much,
Naoki
Copy link to clipboard
Copied
Wow, that was a lot of work to get it installed! I'm glad you finally got it working.

Find more inspiration, events, and resources on the new Adobe Community
Explore Now
 AdChoices