Copy link to clipboard
Copied
I understand how to read a histogram to see if you have clipping in the blacks and white. But what if you have spikes in the center of the histogram - in the midtones - that run all the way beyond the top of the chart. Is that an indication of a problem that needs to be fixed?
That is just a graph that shows the number of pixels of a certain value, so if you have a spike in the mid-tone areas, it just means that you have more of a certain color pixel that can be shown on the graph. There is no clipping with midtone values. Not really something you need to correct. All depends on your image. If you're getting banding in your image, which could show as spikes, you might need to use a higher bit image, say 16 bit rather than 8, so when you make corrections, the values ar
...Copy link to clipboard
Copied
That is just a graph that shows the number of pixels of a certain value, so if you have a spike in the mid-tone areas, it just means that you have more of a certain color pixel that can be shown on the graph. There is no clipping with midtone values. Not really something you need to correct. All depends on your image. If you're getting banding in your image, which could show as spikes, you might need to use a higher bit image, say 16 bit rather than 8, so when you make corrections, the values aren't compressed.
Copy link to clipboard
Copied
If this (below) would be the histogram of a photo, there would be a problem:
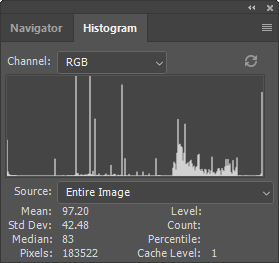
The spikes and the large area of no data shows either a badly modified photo or it's not a photo at all. in this case it's the screen shot of a dialogue box.
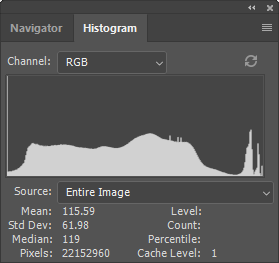
Above is a standard histogram of a photograph. The spikes right to the middle are caused by artificial elements, in this case text pasted into the photograph.
Find more inspiration, events, and resources on the new Adobe Community
Explore Now