Known Participant
January 25, 2016
Answered

How to debug plugin in Visual Studio 2013?

  • January 25, 2016
  • 1 reply
  • 6825 views

I followed all the necessary steps as descripted in the Plugin Apps Developer Guide document to debug a plugin into Visual C++:

Specify the Acrobat plug-ins directory under the link | output tab in the Project settings dialog box.

● Specify the Acrobat or Adobe Reader executable under the executable for debug session in the Project settings dialog box.

● The first time you build a plug-in, do a Rebuild All.

● Set breakpoints in your source code by selecting the line and clicking the hand icon or pressing the F9 key.

● After setting breakpoints, press the F5 key to have Microsoft Visual Studio launch Acrobat or Adobe Reader.

However I received the following message when a press F5 key:

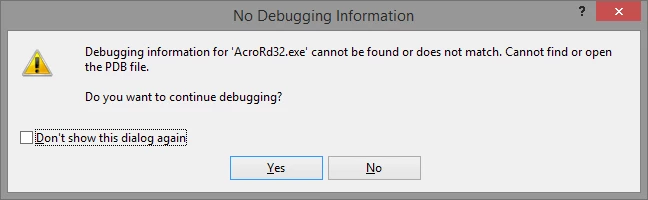
Of course I don't have PDB file of Acrobat's executable. So what do I have to do? Other question, the plugin have a lot of callbacks, can VS handle that?

Thanks,

Rodrigo Gonçalves.

This topic has been closed for replies.
Correct answer Test Screen Name

Sorry for the misunderstanding. I do own Acrobat, but VS doesn't launch Acrobat after press F5. Only appears that message that I showed earlier. Setting of my project bellow:

Configuration Properties > Debugging > Command  => C:\Program Files (x86)\Adobe\Acrobat Reader DC\Reader\AcroRd32.exe

Configuration Properties > Debugging > Working Directory  => C:\Program Files (x86)\Adobe\Acrobat Reader DC\Reader\


However, the Acrobat process appears in Windows Task Manager as background process.


‌Stop trying to launch Reader. Lauch Acrobat. Build plugins to the Acrobat plug_ins folder not Reader. 

1 reply

Karl Heinz  Kremer
Community Expert
Community Expert
January 25, 2016

Just click on "Yes". You cannot debug Acrobat, but you can debug your own plug-in. The debugger has all the information it needs to allow you to debug your own code. Just set a breakpoint in e.g. the handshake functions and you should be able to see what's going on. If you don't get to the handshake functions, chances are that your plugin is not being loaded successfully. In that case, check that all libraries your plug-in depends on are available in directories where they can be found. And yes, all the callbacks should be handled correctly.

Known Participant
January 25, 2016

Ok I've tried press "Yes" but the breakpoint could not be hit. I set the breakpoint in PIHandshake function for test and it doesn't work. I tried also to open the Modules window to load the modules and the only module that does not load is the AcroRd32.exe. Because of this I think that was the problem.


I've googled and I tried a lot of combination of settings by changing the working directory, the command to load Acrobat Reader executable, the post-build event command to enable plugin into Adobe directory, etc. As well as attach to process. None of these attempts were successful.


In my case I want to debug the DocSign sample, therefore I presume that libraries is all available and can be found.

Karl Heinz  Kremer
Community Expert
Community Expert
January 25, 2016

Unless you are creating your own plug-in and have RIKLA (Adobe Reader Integration Key License), you cannot load or debug a plug-in in Reader. You will need Adobe Acrobat to play around with the sample plug-ins.