Participant
December 11, 2021
Question

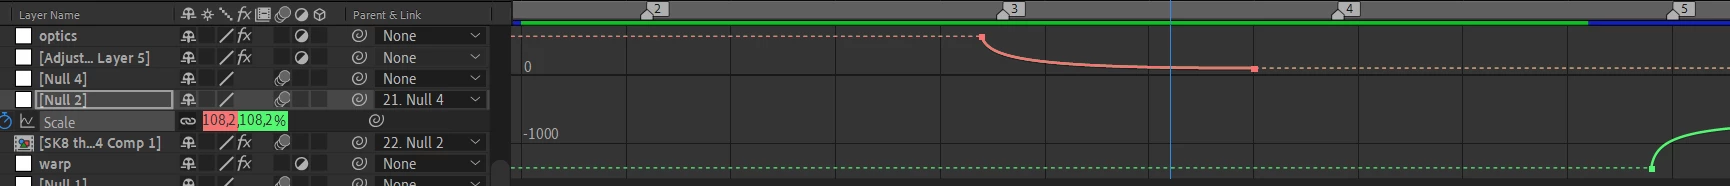
Graph editor shows two graphs green and red

  • December 11, 2021
  • 1 reply
  • 784 views

As you can see the graph editor is showing me two graphs. The one that I selected and want to edit is the red one. The green one I have no idea what is doing there. Besides that, the values go from 0 to -1000 which makes the zoom transition I'm doing very exaggerated... 

This topic has been closed for replies.

1 reply

Jose Panadero
Community Expert
Community Expert
December 11, 2021

The green one represents your Y Scale. This occurs when you deactivate the chain icon when animating the scale and modify the parameters independently.

Participant
December 12, 2021

That's what I thought but it was actually the graph icon next to the stopwatch. I clicked on it somewhere else. Thanks for the reply tho 👍