Participant
February 17, 2022
Question

my graph shows two green and red lines and i'm used to just messing with the red one

  • February 17, 2022
  • 1 reply
  • 339 views

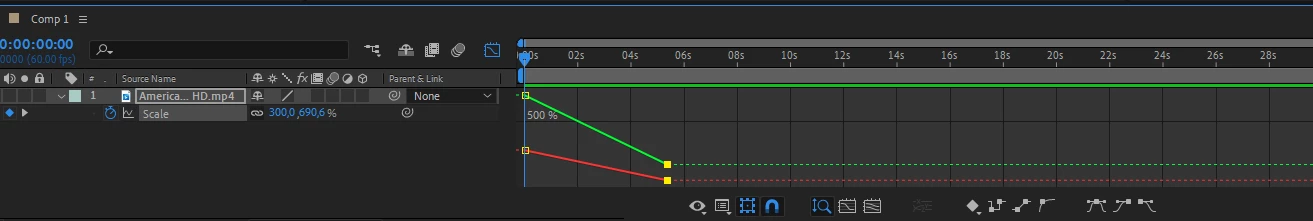
my speed graph show two lines and i'm not used to it i used to use just one line to make my edits i need urgent help

This topic has been closed for replies.

1 reply

Community Expert
February 18, 2022

If there is only one line for Scale you are looking at the Speed graph. Your screenshot shows the Value Graph. There are two values in the array so there will be two lines in the value graph.

Participant
February 18, 2022

i chose the speed value graph but still appears this two lines 

Community Expert
February 18, 2022

Sorry, I missed that you are animating Scale and have different X and Y scale values.


 If Scale is linked like it is in your screenshot, then moving either point will move both X and Y at the same time. Unlink Scale and you can adjust the timing of each value. If X and Y are equal, there will be only one line.


Scale in the graph editor will always display 3 lines for 3D layers and 2 for normal layers. Position will have one line white line for Speed and up to three for X, Y, and Z for Value. It is extremely difficult to edit the Value Graph for Position so speed is the best option, so speed is the only option. It is a little easier to animate Scale with either the Speed or the Value graph.