Participant
January 10, 2024
Answered

Not being able to edit rows and columns in .mogrt files in premier pro

  • January 10, 2024
  • 1 reply
  • 469 views

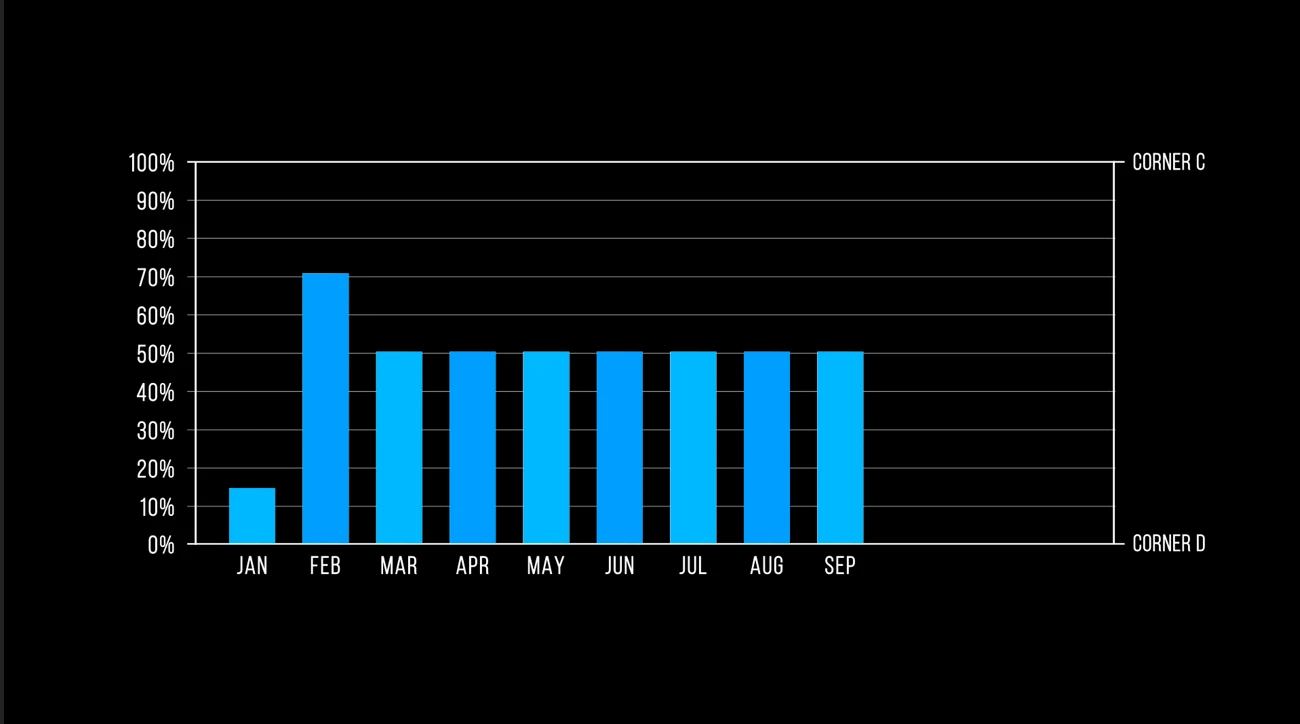
so i'm not able to edit my .mogrt files in premier pro, 

is there anyway that i can add rows or columns to my .mogrt file? this is a animated chart that i downloaded from adobe stock. if i can't basically add anything to my chart what's the point? i can only play around with text and colors and basically whatever options there in premier pro! there are fixed rows and columns 

This topic has been closed for replies.
Correct answer Theresa Rostek

I loaded up the mogrt - it looks like it is locked to 12 data points as shown in the preview video. You could reduce the data points you don't need to 0 and remove the bottom text in TEXT group -> Text A input. The outer line will still remain at the full size, there are no controls to reduce these.


Customizing an infographic is possible in After Effects, but it requires expressions knowledge. If that doesn't work for you, you may request a refund by clicking on the chat pod on the lower right corner: https://helpx.adobe.com/contact.html

I do recommend giving https://stock.adobe.com/templates/data-driven-wavy-line-graph-infographic/347918363 or https://stock.adobe.com/templates/data-driven-horizontal-bar-graph-infographic/347918198 a try and see if they fit your needs. These are both free templates and you will be able to customize between 1 and 12 data points.

1 reply

Theresa Rostek
Community Manager
Community Manager
January 10, 2024

Hi @Masrm,

If you downloaded a data driven mogrt, you'll want to select "Edit Spreadsheet Data" 

Many of these mogrts provide controls to be able to select how many columns/rows to show.

Non data-driven mogrts may have some controls for that sort of flexibility, but it depends on how the author built it. In that case, it may need to be customized a little further in After Effects.

What's the link of the mogrt you downloaded from Adobe Stock? It'll help me walk you through how to use it. 


Cheers,

Theresa

Motion Graphics, Premiere Pro
MasrmAuthor
Participant
January 10, 2024
Theresa Rostek
Community Manager
Theresa RostekCommunity ManagerCorrect answer
Community Manager
January 10, 2024

I loaded up the mogrt - it looks like it is locked to 12 data points as shown in the preview video. You could reduce the data points you don't need to 0 and remove the bottom text in TEXT group -> Text A input. The outer line will still remain at the full size, there are no controls to reduce these.


Customizing an infographic is possible in After Effects, but it requires expressions knowledge. If that doesn't work for you, you may request a refund by clicking on the chat pod on the lower right corner: https://helpx.adobe.com/contact.html

I do recommend giving https://stock.adobe.com/templates/data-driven-wavy-line-graph-infographic/347918363 or https://stock.adobe.com/templates/data-driven-horizontal-bar-graph-infographic/347918198 a try and see if they fit your needs. These are both free templates and you will be able to customize between 1 and 12 data points.

Motion Graphics, Premiere Pro