
Speed graph to value graph mathematics
Hello everyone,
I recently stumbled upon this post that was made in 2013: https://community.adobe.com/t5/after-effects-discussions/bezier-curve-conversion-between-value-graph-and-speed-graph/m-p/5741221#M141939 talking about the mathematics for converting speed graphs to value graphs. I found the math to be fairly simple for one dimension, but with multi-dimension calculations, specifically in python, my curve values don't seem correct. The author hagmas provided a solution in which I tried to implement, but it seems incorrect when I run my own numbers.
Python:
import math

x_first, x_last = 0, 100
y_first, y_last = 0, 200
z_first, z_last = 0, 0

duration = 30

x_diff = abs(x_first - x_last)
y_diff = abs(y_first - y_last)
z_diff = abs(z_first - z_last)

x_avg, y_avg, z_avg = x_diff / duration, y_diff / duration, z_diff / duration
avg_speed = math.sqrt(x_avg * x_avg + y_avg * y_avg + z_avg * z_avg)

in_influence, out_influence = 0.50, 0.50
in_speed, out_speed = 200, 0

bezier_in = {}
bezier_in["x"] = 1 - in_influence
bezier_in["y"] = 1 - in_speed / avg_speed * in_influence

bezier_out = {}
bezier_out["x"] = out_influence
bezier_out["y"] = out_speed / avg_speed * out_influence

print(bezier_in, bezier_out)

# result: {'x': 0.5, 'y': -12.416407864998737} {'x': 0.5, 'y': 0.0}
When doing this same scenario in After Effects and reading the graph value from the AEScripts flow plugin, it shows me this graph result:
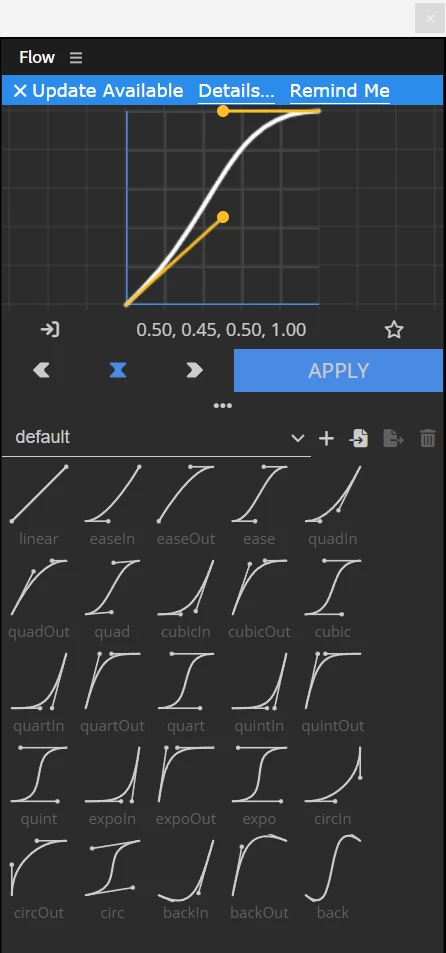
The y-value of the left bezier should really be closer to 0.447 for accuracy, but it's being rounded in the plugin. Here is the speed graph view in AE:
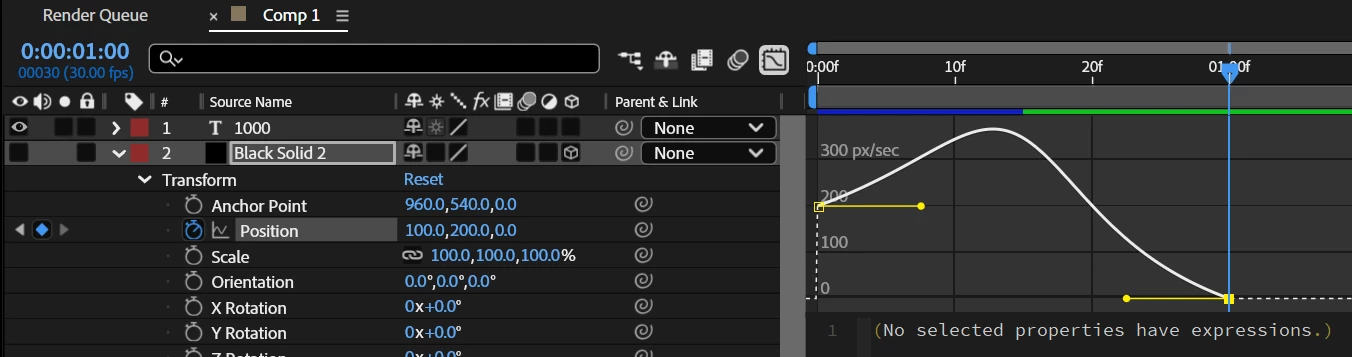
which reflects the scenario where:
x: 0 -> 100 in 30 frames
y: 0 -> 200 in 30 frames
left handle influence: 50%
left handle speed: 200
right handle influence: 50%
right handle speed: 0
Is my python calculations wrong, or am I not utilizing the output correctly to normalize the bezier curve correctly? I would appreciate any help!
