Plotting graphs using AS3
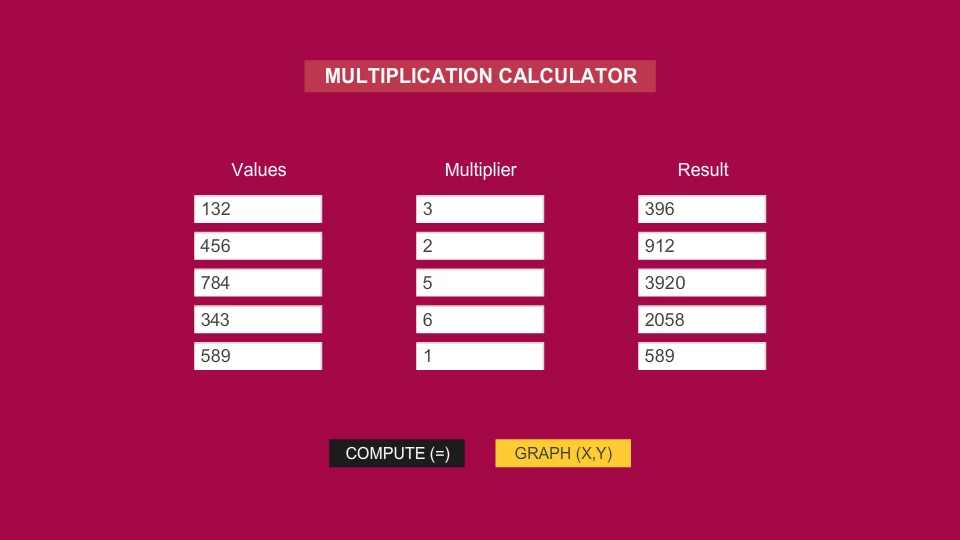
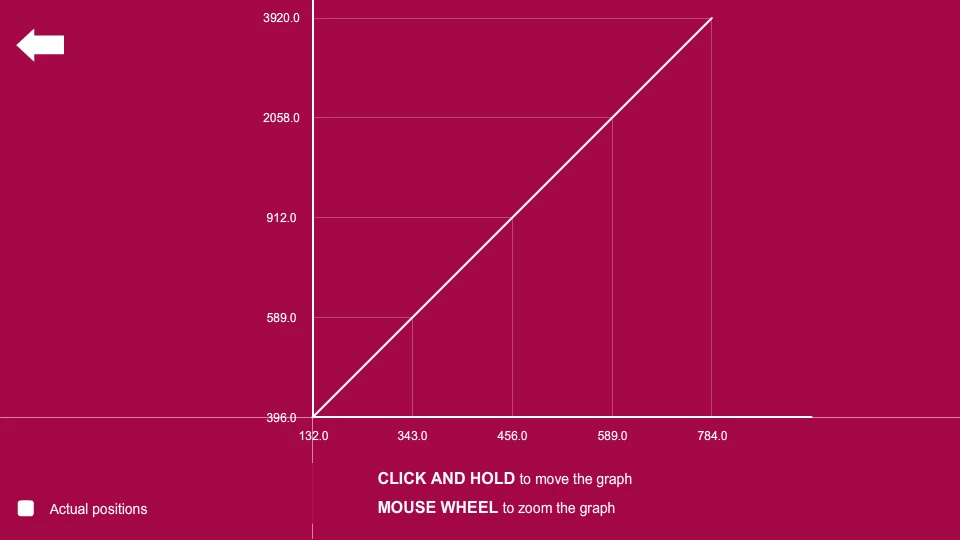
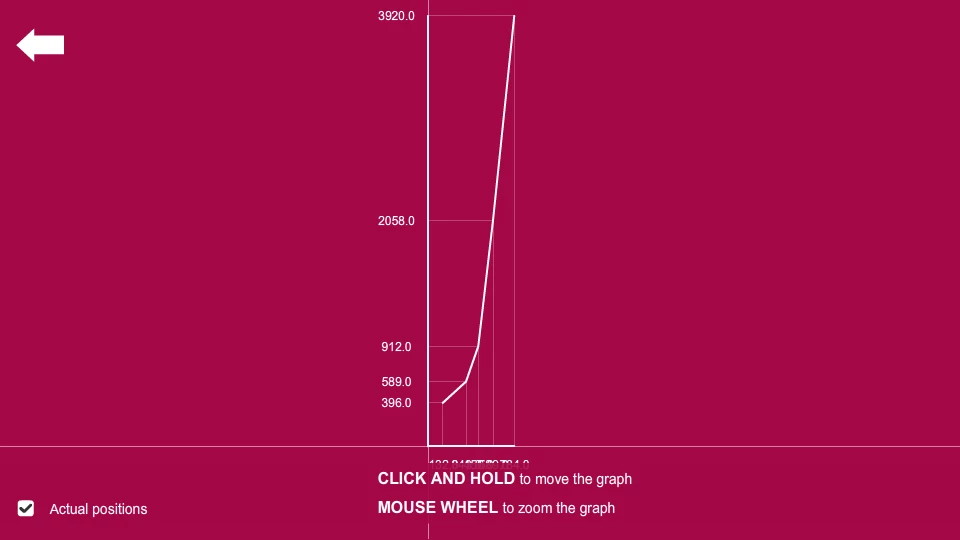
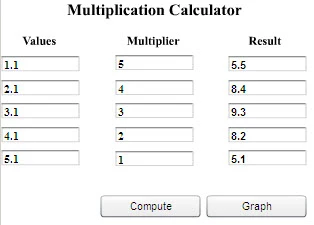
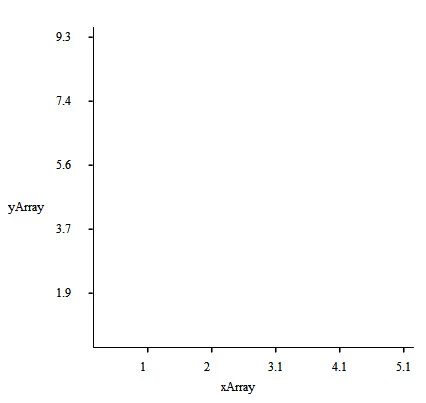
Hi, I am new to Actionscript 3. I have been learning how to code in AS3 on the go from forums on the net and from Youtube videos, so if anything I've said in this post is inappropriate as far as coding in AS3 is concerned, I apologize for the same. I am trying to create a graph as shown in the image with the inputs on the X-axis and the result on the Y-axis. I have also attached a screenshot of the inputs and resulting outputs. I have coded most of it, but I cannot figure out how to actually plot the graph corresponding to the input and resulting output values. I also want to improve the code given below for the "x" and "y" position of the text boxes (xtBox and ytBox, respectively), the horizontal and vertical markers (hLine and vLine respectively), and the "x" and "y" text labels (xLabel and yLabel, respectively). "x" and "y" arrays have to be sorted in ascending order, the maximum value has to be divided by the length of the array to display the numerical text on the axis with even distribution (as we used to do while taking units for plotting of graphs in math class in school). It would also be great if someone could tell me how to shrink the code, if at all it can be reduced (I have done the best I could using arrays). I use Adobe Flash CS6 on a Windows 7 32-bit machine.
Calculating the result
Graph
The code is given below:
//Creating the graph
graph.addEventListener(MouseEvent.CLICK, graphBtn);
function graphBtn(event:MouseEvent):void
{
gotoAndStop(2);
var spBoard:Sprite = new Sprite();
addChild(spBoard);
spBoard.x = 0;
spBoard.y = 0;
var nSize:Number = 320;
//var nPoints:Number = 320;
var shAxes:Shape = new Shape();
spBoard.addChild(shAxes);
drawAxes();
function drawAxes():void
{
shAxes.graphics.clear();
shAxes.graphics.lineStyle(1,0x000000);
//Draw y-axis
shAxes.graphics.moveTo(0,0);
shAxes.graphics.lineTo(0,nSize);
//Draw x-axis
shAxes.graphics.moveTo(0,nSize);
shAxes.graphics.lineTo(nSize,nSize);
}
//Input on X-axis//
var xXPos = spBoard.x+44;
var xYPos = spBoard.y+nSize+10;
var vxXPos = spBoard.x+54;
var vyYPos = spBoard.y+nSize+3;
var inputArray:Array = [];
for (i=0; i<textInputs.length; i++)
{
inputArray.push(Number(textInputs.text));
}
inputArray.sort(Array.NUMERIC);
var xlastValue = inputArray[4]/inputArray.length;
trace (xlastValue);
var xtempArray:Array = [Math.round((xlastValue)*10)/10,Math.round((xlastValue*2)*10)/10,Math.round((xlastValue*3)*10)/10,Math.round((xlastValue*4)*10)/10,Math.round((xlastValue*5)*10)/10];
trace (xtempArray);
for (i=0; i<inputArray.length; i++)
{
var xArray:Array = xtempArray;
var xtBox = new (TextField);
xtBox.text = String(xArray);
spBoard.addChild(xtBox);
xtBox.x = xXPos;
xXPos+=64;
xtBox.y = xYPos;
var vLine = new (VLine);
spBoard.addChild(vLine);
vLine.x = vxXPos;
vxXPos+=64;
vLine.y = vyYPos;
}
var xLabel = new (TextField);
xLabel.text = String("xArray");
spBoard.addChild(xLabel);
xLabel.x = 125;
xLabel.y = nSize+30;
trace("X Array: "+xArray);
//Result on Y-axis//
var yXPos = spBoard.x-40;
var yYPos = spBoard.y;
var hxXPos = spBoard.x-3;
var hyYPos = spBoard.y+10;
var resultArray:Array = [];
for (i=0; i<textOutputs.length; i++)
{
resultArray.push(Number(textOutputs.text));
}
resultArray.sort(Array.NUMERIC);
var ylastValue = resultArray[4]/resultArray.length;
trace (ylastValue);
var ytempArray:Array = [Math.round(ylastValue*10)/10,Math.round((ylastValue*2)*10)/10,Math.round((ylastValue*3)*10)/10,Math.round((ylastValue*4)*10)/10,Math.round((ylastValue*5)*10)/10];
trace (ytempArray);
ytempArray.reverse();
for (i=0; i<resultArray.length; i++)
{
var yArray:Array = ytempArray;
var ytBox = new (TextField);
ytBox.text = String(yArray);
spBoard.addChild(ytBox);
ytBox.x = yXPos;
ytBox.y = yYPos;
yYPos+=64;
var hLine = new (HLine);
spBoard.addChild(hLine);
hLine.x = hxXPos;
hLine.y = hyYPos;
hyYPos+=64;
}
var yLabel = new (TextField);
yLabel.text = String("yArray");
spBoard.addChild(yLabel);
yLabel.x = -88;
yLabel.y = 170;
trace("Y Array: "+yArray);
}