Ok, here is my explanation of what's in the SDK example looktable.csv, which is making the "cool colors" black and leaving the other colors alone.
The three numbers in each row of the look table are:
Hue-Delta number, (+/- hue) where 0 means no change in hue.
Saturation-Scale number, (x saturation) where 1 means no change in saturation.
Value-Scale number (x value or brightness) where 1 means no change in brightness.
In the looktable.csv example, most of the rows have 0, 1, 1, meaning no change in the H, S, or V numbers.
For "cool colors" however, we have 0, 1, 0, meaning set the brightness to 0 but leave the hue and saturation alone.
In general, hues are given in degrees from 0 to 360 representing red, orange, yellow, green, blue, purple, back-to-red. What are "cool colors"? They are the cyans, blues and purples.
In the example looktable.csv the first line header has 4 numbers: 8, 3, 4, 1 where 8 is the number of hue segments.
Visually it looks like this, with the hue scale of 0-360 is divided into 8 segments labeled 0 to 7, so the cool hues are segments 4, 5, 6, or if there is rounding 3.5 to 6.5, not sure, and "cool colors" is somewhat open to interpretation, and I'd probably only have it be segments 4 and 5, not also 6, but I'm trying to explain what the looktable.csv is about, not how I'd make it different:
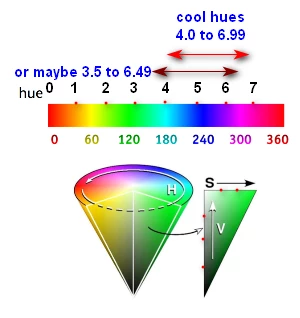
Besides the Hues being divided into 8 segments, the Saturation axis is divided into 3 segments and the Value axis into 4. I've indicated this with the, unintentionally unevenly-spaced, red dots.
All that is somewhat easy to understand. The difficulty is understanding what rows in the look table correspond to what colors in the rainbow-strip and HSV-cone in the illustration, above.
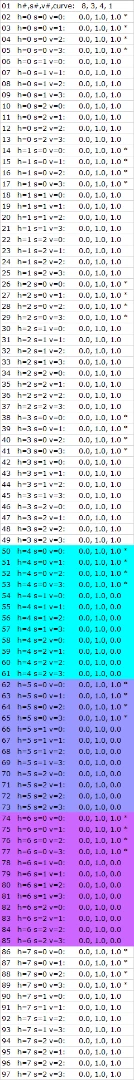
To determine this, based on the pseudo-code in the PDF, I wrote a C# program in LINQPad 5 to output not only the rows of the looktable.csv but also the corresponding HSV color-segment numbers, where the Hue segment numbers go from 0 to 7 (8 segments), the Saturation-segment numbers go from 0 to 2 (3 segments) and the Value segment numbers go from 0 to 3 (4 segments).
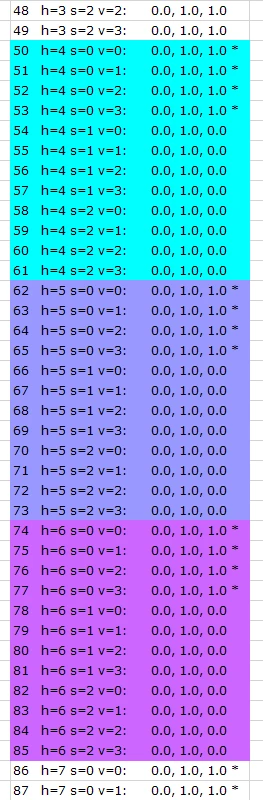
Here is the portion of the output dealing with the "cool colors" Hue segments 4, 5, 6, where I've changed the background color of the Excel spreadsheet rows to indicate the approximate "cool color" the hue segment is.
Here is a screenshot of my C# code in LINQPad. It didn't make sense that the pseudo-code had the v segment numbers at 1 instead of 0 like the h and s segment numbers, and it didn't make sense to do something when v was 0 so I left that out as well:
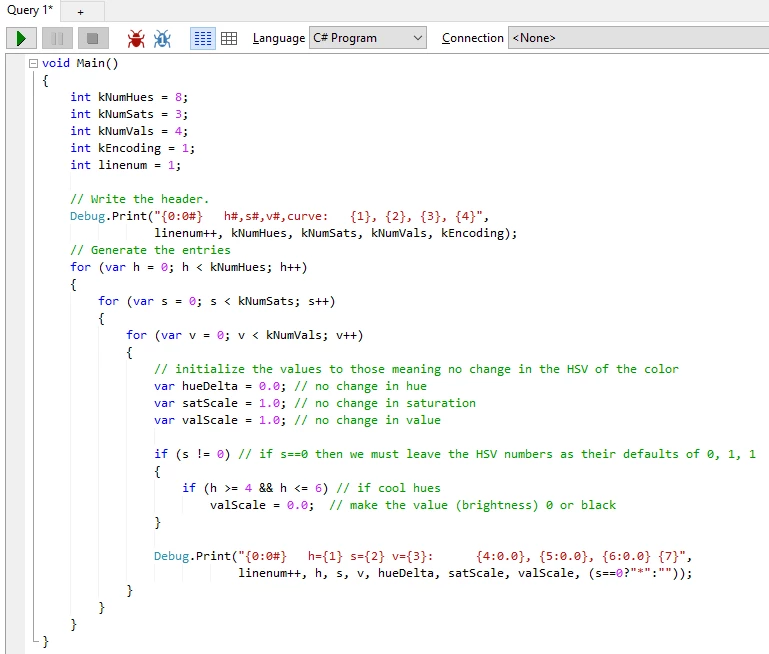
LINQPad is available, here, where the free version doesn't do auto-formatting or auto-completion, but otherwise works:
http://www.linqpad.net/
And here is the entire output of the program, all 97 lines, that correspond to the 97 lines of looktable.csv: