Inspiring
March 22, 2021
Question

CFChart legend with bar chart

  • March 22, 2021
  • 1 reply
  • 266 views

I have a simple chart based off a simple query. I am trying to display the various value labels in the legend. If I set the chart type to bar, the legend just shows "Series 1" as the label. If I change the chart type to pie, then everything displays fine. Is this a known bug or am I doing something wrong? 


The query gives me output like 

 COUNTDAMAGE
1757Complete
2248Landscape
31060N/A
4938Partial
5318Smoke
61464Unknown


My chart definition is:


<cfchart format="html" xaxistitle="Damage" yaxistitle="Calamities" style="blue" showlegend="true" chartheight="400" chartwidth="500" title="Damage Distribution" labelformat="number" >
<cfchartseries type="bar" query="damage" itemcolumn="damage" valuecolumn="count" colorlist="##b7e1f3,##189aa8,##aad356,##f9c908,##f35844" >
</cfchartseries>
</cfchart>


The result is:

I would have expected each color to be in the legend with the label for that data (Complete, landscape, partial, etc). If all I change in the code is type="pie" for the char series I get this:


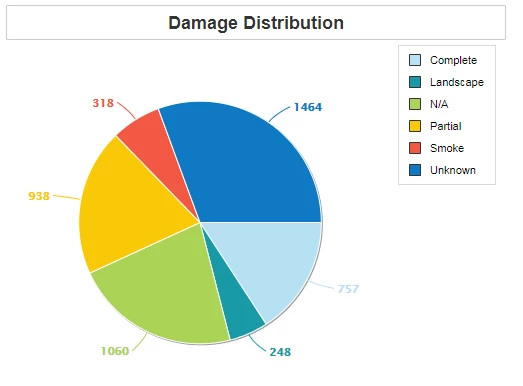
Any ideas as to what I'm doing wrong?

    This topic has been closed for replies.

    1 reply

    BKBK
    Community Expert
    Community Expert
    March 25, 2021

    Hi @TransoniqHacker ,


    You've done nothing wrong. I think that that is how ColdFusion displays bar charts. 


    Your bar chart consists of just 1 chartseries. Hence, the legend consists of just one item. If you don't define the label, ColdFusion will use the default label, "Series".


    To make the chart more relevant to your case, add the attribute label="Damage" to the cfchartseries tag. However, as I have explained, there will still just be 1 item in the Legend.


    Nevertheless, there is a trick you can use to get 1 legend item for every bar: split the query data into 6 separate chartseries. For example, using query-of-query.


    First off, change the name of the column from count to, say, counter. That is because count is a keyword in SQL.


    Then proceed as follows:


    <cfquery name="damage1" dbType="query">
    	select counter 
    	from damage
    	where damage='Complete'
    </cfquery>
    <cfquery name="damage2" dbType="query">
    	select counter 
    	from damage
    	where damage='Landscape'
    </cfquery>
    <cfquery name="damage3" dbType="query">
    	select counter 
    	from damage
    	where damage='N/A'
    </cfquery>
    <cfquery name="damage4" dbType="query">
    	select counter 
    	from damage
    	where damage='Partial'
    </cfquery>
    <cfquery name="damage5" dbType="query">
    	select counter 
    	from damage
    	where damage='Smoke'
    </cfquery>
    <cfquery name="damage6" dbType="query">
    	select counter 
    	from damage
    	where damage='Unknown'
    </cfquery>
    
    <cfchart format="html" xaxistitle="Damage" yaxistitle="Calamities" style="blue" showlegend="yes" chartheight="400" chartwidth="500" title="Damage Distribution" labelformat="number" >
    
    <cfchartseries type="bar" query="damage1" itemcolumn="damage" valuecolumn="counter" label="Complete" seriescolor="##b7e1f3">
    </cfchartseries>
    <cfchartseries type="bar" query="damage2" itemcolumn="damage" valuecolumn="counter" label="Landscape" seriescolor="##189aa8">
    </cfchartseries>
    <cfchartseries type="bar" query="damage3" itemcolumn="damage" valuecolumn="counter"  label="N/A" >
    </cfchartseries>
    <cfchartseries type="bar" query="damage4" itemcolumn="damage" valuecolumn="counter" label="Partial" seriescolor="##aad356">
    </cfchartseries>
    <cfchartseries type="bar" query="damage5" itemcolumn="damage" valuecolumn="counter" label="Smoke" seriescolor="##f9c908">
    </cfchartseries>
    <cfchartseries type="bar" query="damage6" itemcolumn="damage" valuecolumn="counter"  label="Unknown" seriescolor="##f35844">
    </cfchartseries>
    
    </cfchart>


    BKBK
    Community Expert
    Community Expert
    March 25, 2021

    The above is the solution that immediately came to mind. I am sure that, after a search and some thought, you could find a shorter, more efficient solution that uses the underlying ZingCharts engine.