

Question
Custom labels on y-axis in Webcharts
Hello!
Our customer wants to have labels on one of the axes displaying a percentage which is not part of the graph data. For example:
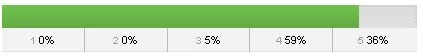
So far I have created this using Webcharts:
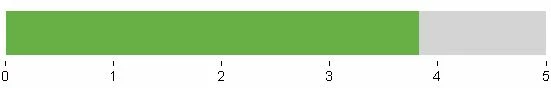
Using this model:
<?xml version="1.0" encoding="UTF-8"?>
<XML type="default">
<COL></COL>
<ROW col0="3.8"></ROW>
<ROW col0="1.2"></ROW>
</XML>
When I look at the YAxis, there’s a Category type. And I see non-numerical labels (Africa, Asia etc). Might it be used somehow?
To summarize: I want to add a label with a percentage to each scale step. The percentages are not part of the model data.
Please advice!
Regards,
Pelle P