Answered
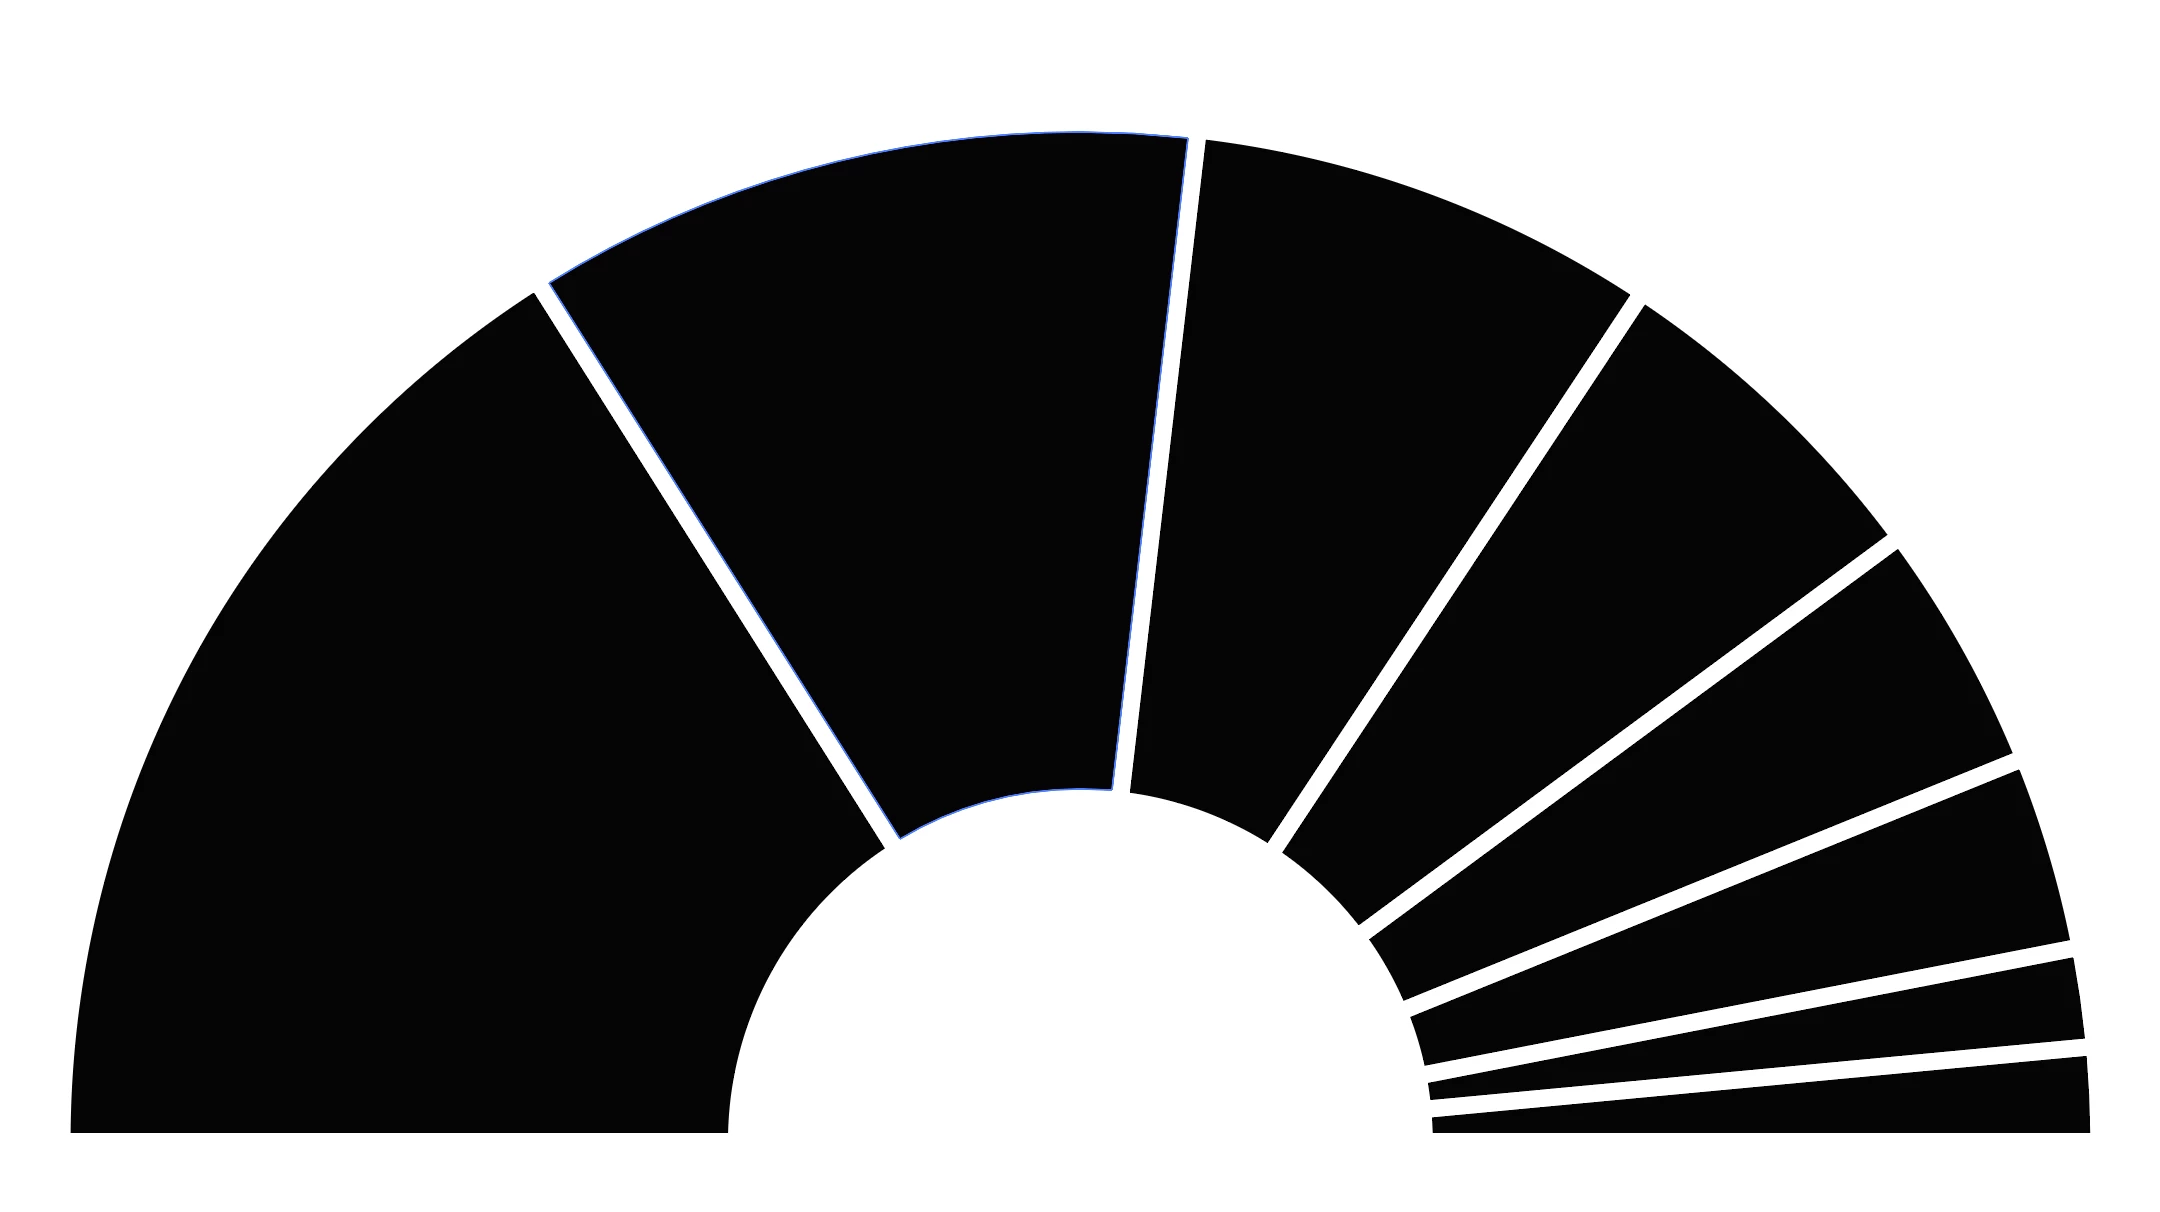
Drawing a circle segment by script.
Hey there,
how would you guys set up an illustrator script that can draw circle segments (like in a pie chart)?
Thank you very much!
u

Hey there,
how would you guys set up an illustrator script that can draw circle segments (like in a pie chart)?
Thank you very much!
u
Here is an example code of creates sector.
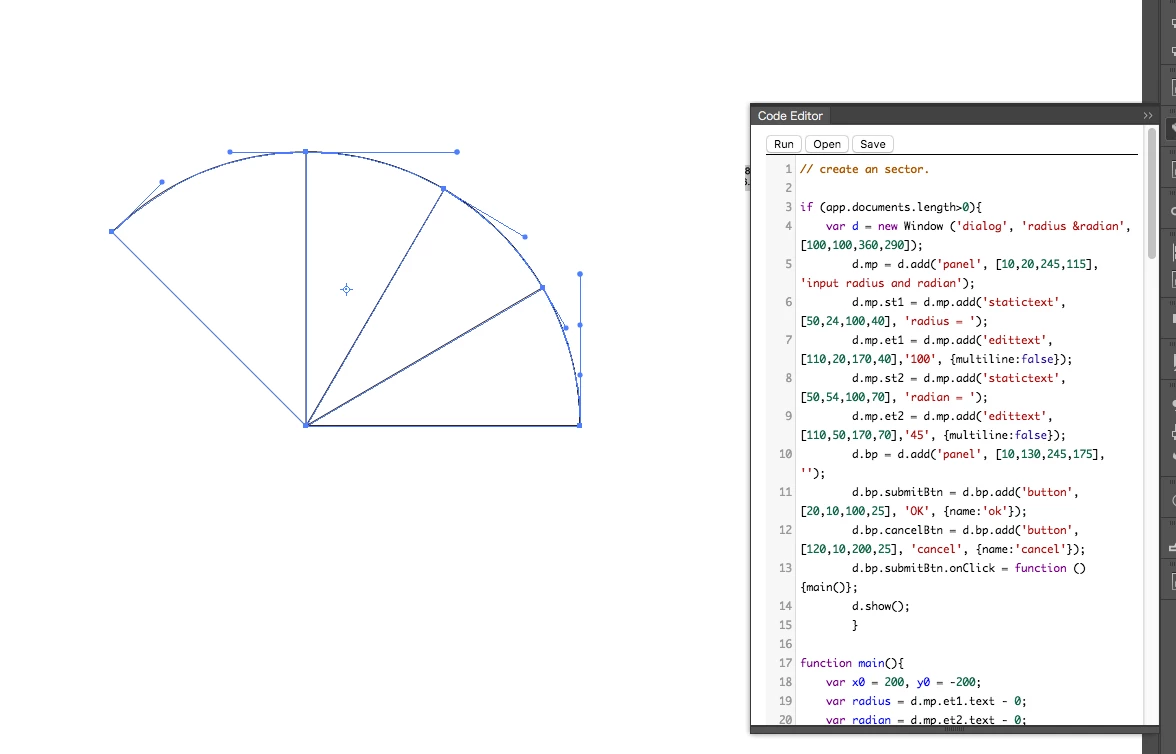
// create an sector.

if (app.documents.length>0){
	var d = new Window ('dialog', 'radius &radian', [100,100,360,290]);
		d.mp = d.add('panel', [10,20,245,115], 'input radius and degree');
		d.mp.st1 = d.mp.add('statictext', [50,24,100,40], 'degree = ');
		d.mp.et1 = d.mp.add('edittext', [110,20,170,40],'100', {multiline:false});
		d.mp.st2 = d.mp.add('statictext', [50,54,100,70], 'degree = ');
		d.mp.et2 = d.mp.add('edittext', [110,50,170,70],'45', {multiline:false});
		d.bp = d.add('panel', [10,130,245,175], '');
		d.bp.submitBtn = d.bp.add('button', [20,10,100,25], 'OK', {name:'ok'});
		d.bp.cancelBtn = d.bp.add('button', [120,10,200,25], 'cancel', {name:'cancel'});
		d.bp.submitBtn.onClick = function (){main()};
		d.show();
		}

function main(){
	var x0 = 200, y0 = -200;
	var radius = d.mp.et1.text - 0;
	var radian = d.mp.et2.text - 0;
	d.close();
	if (radian>180) alert("We support 0 to 180 degree.");
	var lnColor = new GrayColor;
	lnColor.gray = 100;

	var ln = app.activeDocument.pathItems.add();
	ln.stroke = true;
	ln.strokeColor = lnColor;
	ln.strokeWidth = 0.3;
	ln.filled =false;

	var pt0 = ln.pathPoints.add()
	pt0.anchor = Array(x0+radius, y0);
	pt0.rightDirection = Array(x0+radius, y0+(Math.sqrt (2)-1)/3*4*radius);
	var pt1 = ln.pathPoints.add();
	pt1.anchor = Array(x0, y0+radius);
	pt1.leftDirection = Array(x0+(Math.sqrt (2)-1)/3*4*radius, y0+radius);
	if (90<radian&&radian<=180) {
		pt1.rightDirection = Array(x0-(Math.sqrt (2)-1)/3*4*radius, y0+radius);
		var pt2 = ln.pathPoints.add();
		pt2.anchor = Array(x0-radius, y0);
		pt2.leftDirection = Array(x0-radius, y0+(Math.sqrt (2)-1)/3*4*radius);
		}
	if (radian<=90) {
		if (radian<90) mvPath(pt0, pt1, radian/90);
		pt0.leftDirection = pt0.anchor;
		pt1.rightDirection = pt1.anchor;
		var p2 = ln.pathPoints.add();
		p2.anchor = Array(x0, y0);
		p2.leftDirection = p2.anchor;
		p2.rightDirection = p2.anchor;
		ln.closed = true;
		} else if (90<radian&&radian<=180){
			if (radian<180) mvPath(pt1, pt2, (radian-90)/90);
			pt0.leftDirection = pt0.anchor;
			pt2.rightDirection = pt2.anchor;
			var p3 = ln.pathPoints.add();
			p3.anchor = Array(x0, y0);
			p3.leftDirection = p3.anchor;
			p3.rightDirection = p3.anchor;
			ln.closed = true;
			}
	}

function mvPath(p0,p1,ratio){
	var pt = new Array();
	var nwPt = new Array();

	pt[0] = p0.anchor;
	pt[1] = p0.rightDirection;
	pt[2] = p1.leftDirection;
	pt[3] = p1.anchor;

	p0.rightDirection = linearSprit(pt[0], pt[1], ratio);
	p1.anchor = nwAnchor (pt[0], pt[1], pt[2], pt[3], ratio);
	p1.leftDirection = nwDirection (pt[0], pt[1], pt[2], ratio);
	return true;
	}

function linearSprit (p0, p1, t) { //linear bezier
	var dirPt = new Array();
	for (i=0;i<2;i++){
		dirPt[i] = p1[i] * t + p0[i] * (1 - t);
		}
	return dirPt;
	}

function nwDirection(p0, p1, p2, t){ //quadratic bezier
	var dirPt = new Array()
	for (i=0;i<2;i++){
		dirPt[i] = (Math.pow ((1 - t), 2) )* p0[i]
					+ 2 * (1 - t) * t * p1[i]
					+ t * t * p2[i] ;
		}
	return dirPt;
	}

function nwAnchor(p0,p1,p2,p3, t){ //cublic bezier
	var spPt = new Array()
	for (i=0;i<2;i++){
		spPt[i] = (Math.pow ((1 - t), 3)) * p0[i]
					+ 3 * (Math.pow ((1 - t), 2)) * t * p1[i]
					+ 3 * (Math.pow (t, 2)) * (1 - t) * p2[i]
					+ Math.pow (t, 3) * p3[i] ;
		}
	return spPt;
	}
Already have an account? Login
Enter your E-mail address. We'll send you an e-mail with instructions to reset your password.