I love scripting! Been learning as I go though over the years, I figure out what I want to do and study scripts to figure it out to make new ones, and when I get stuck, adobe community is a huge life line! greatful when I get to contribute to it!
@LynxKx yes! Excellent news! You got me inspired to write a script along these lines, so here it is below.
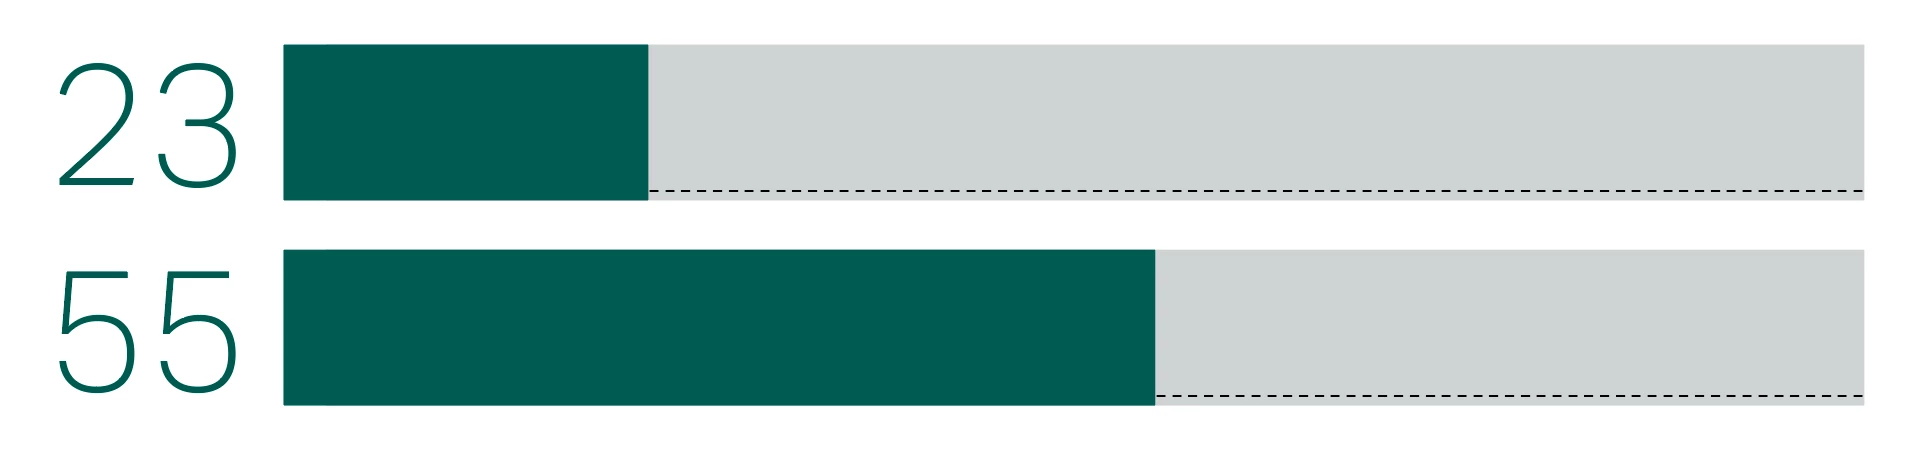
If anyone wants to give it a try, to please open the attached demo.indd and try that first. Here's a screen shot of before and after running script on demo document:
You can easily make your own graph bars or pies in your own document, but at first it might be easiest to look at mine or even copy/paste them. They are very simple: a bar element is a bunch of coloured rectangles pasted into another rectangle, and a pie element is a bunch of coloured polygons pasted into a frame, usually a circle.
The elements are just a page item anchored nearby to the graph value text,usually within a few characters (the script will connect the closest one found).
Let me know what you think.
- Mark
/**
 * @file Update Graph Elements.js
 *
 * Update graph elements (bars, lines or pie slices) to reflect
 * the associated text value(s), either manually entered, or populated
 * with data merge.
 *
 * IMPORTANT: very little testing done on this script!
 * Please let me know when you find bugs.
 *
 * Disclaimer: this is NOT a comprehensive graphing solution.
 *
 * Usage:
 *
 *  - Run script in a document containing graph elements (see demo.indd).
 *    Script will update graphs in the selection or, if no selection,
 *    will update ALL graphs in document.
 *
 * The script works this way:
 *
 *  1. Finds all instances of graph values, which are numbers, or set of
 *     numbers, with the "Graph Value" Character Style applied.
 *
 *  2. Finds any anchored graph elements (pie or bar) near
 *     the character (by default it looks two characters
 *     either side).
 *
 *  3. Adjusts each graph element to represent the value.
 *
 * Configure your `settings` object:
 *  • findWhat: a findGrep compatible string goes here.
 *  • searchProperties: an object containing any findGrepPreferences properties.
 *  • showResults: whether to show an alert at the end.
 *  • reset: sets all the graphs to zero, no matter what their value.
 *
 * Notes:
 *
 *  - A graph "bar" is just a rectangle pasted inside another
 *    rectangle. Make them different colours!
 *
 *  - A graph pie "slice" is a closed polygon pasted inside any kind of
 *    frame, usually a circle or a donut. Add as many slices as you need
 *    for your graph and style each slice as you like.
 *
 *  - A graph "line" is an open polygon pasted inside any kind of frame,
 *    usually a rectangle. Add as many lines as you need for your graph
 *    and style each slice as you like.
 *
 *  - To embed multiple polygons (or whatever page item you want) into the
 *    graph frame, it is easiest to group it and then "Edit > Paste Into".
 *    This script will try to find the graph elements inside that group.
 *
 *  - A graph bar, pie, or line graph can have multiple values: to do
 *    multi-value charts, separate them by a single, non-digit character,
 *    eg. "10 20 50", but you must set the delimiter in "Graph Value"
 *    Character Style also. The delimiter could be a space, a line feed,
 *    or column break character, for example.
 *
 *    Caution: If you are making a bar graph with multiple bars, each with
 *    a single-value for each bar, you need either (a) two or more characters
 *    between each value, or (b) one or more characters WITHOUT the "Graph Value"
 *    Character Style applied. Failure to do this may cause the script to
 *    populate the bar(s) as multi-value bars.
 *
 *  – The anchored graph element can be pasted either before or after
 *    the value(s) text.
 *
 *  - The script leaves styling of elements to the user.
 *
 *  - Create enough graph elements (eg. polygons pasted inside a circle frame
 *    for a Pie) for the largest number of multi-value graphs. The script will
 *    create extra bars, lines or slices as needed, but it won't style them,
 *    so it will save you time to set up a "master" graph element complete with
 *    styled (using Object Styles is a good idea) bars, lines or slices.
 *
 *    Example creating a pie graph element suitable for showing six slices:
 *      1. Make a circle frame.
 *      2. Draw a closed triangle with pen tool (if it is open, then script will
 *         populate as a line graph).
 *      3. Draw and style six triangles (this is when you would apply Object Styles).
 *         Note: we don't care about the size or position of the triangles at all!
 *         Also if you make too many triangles, that's fine - the script will hide
 *         any elements that don't have values assigned.
 *      4. Group the six triangles.
 *      5. Cut and "Edit > Paste Into" the selected circle frame from step 1.
 *      6. Cut the circle from step 1, and with Type tool, place an insertion point
 *         within 2 characters of your graph values text, eg. on either x is good:
 *         "x20 30 40x", and paste to anchor the graph element.
 *      7. Configure the Anchored Object Options to suit (again, I recommend using
 *         an Object Style).
 *
 * -  Tip: in a datamerge
 *    template document start with graph elements that already have the
 *    internal polygons/rectangles colored as desired or, even better, have
 *    object styles applied. It is fine to have more bars or slices or lines
 *    than you need - they will be hidden by the script.
 *
 *  - One good use case for this script is to use in conjunction with datamerge:
 *    set the graph data merge placeholders in "Graph Value" Character Style
 *    and, after merging, run this script to update the graphs.
 *
 * Configuring via Script Labels:
 *
 * To access some simple configuration options, add key/value pairs
 * to the script label of either the anchored graph element or to the
 * parent text frame. See Window > Utilities > Script Label menu.
 *
 * List of keys:
 *
 * max - sets a upper range for graph values. eg. "max:250;"
 *       Default is 100 for single-value graphs, or the sum of all
 *       values when there are multi-values. Values above this
 *       range will be cropped.
 *
 * min - sets a lower range for graph values. eg. "min:-50;"
 *       Default is 0 for single-value graphs. When multi-values
 *       are present "min" is not used. Values below this range
 *       will be cropped
 *
 * lineCount - in a line graph, the number of lines in the graph, if more than one.
 *
 * vertical - in a line graph, to force the graph into vertical orientation.
 *
 * horizontal - in a line graph, to force the graph into horizontal orientation.
 *
 * filled - a line graph, sets whether a line's path will be drawn so that
 *          it can be filled. You must style the line polygon yourself.
 *
 * flip - in a line graph, whether to flip the axis of the data values.
 *
 * nubSize - in a line graph, the length of the little extension on either edge.
 *
 * overshoot - in a pie graph, how far outside the normal radius the slices extend.
 *
 * startAngle - in a pie graph sets the angle for the first slice.
 *              Default is 0 (pointing right). For example, to set the
 *              start angle pointing up, add label "startAngle:90;"
 *
 * @author m1b
 * @version 2024-09-04
 * @inspiration the cool graphs made by @LynxKx at URL below
 * @discussion https://community.adobe.com/t5/indesign-discussions/grep-to-apply-style-to-variable-number/m-p/14794935
 */

/**
 * Script settings, currently configured
 * to search for positive numbers set in
 * the 'Graph Value' Character Style.
 */
var settings = {
    findWhat: '([\\d,\\.-]\\D?)+',
    searchProperties: { appliedCharacterStyle: 'Graph Value' },
    showResults: true,
    // reset: true,
};

/**
 * A graph bar element.
 * @author m1b
 * @version 2024-08-14
 * @constructor
 * @param {PageItem} item - an item containing a rectangle.
 * @returns {GraphBar}
 */
function GraphBar(item) {

    var self = this;
    self.item = item;
    self.container = GraphBar.getContainer(item);
    self.isValid = undefined != self.container;

    if (!self.isValid)
        return;

    self.bounds = item.geometricBounds;

    // check labels for key/value pairs
    var data = parseKeyValues(
        item.label + ';'
        + item.parent.parentTextFrames[0].label
    );

    // value range
    self.max = getAsNumber(data.max, 100);
    self.min = getAsNumber(data.min, 0);

};

/**
 * Returns true if the item meets
 * the criteria to be a GraphBar.
 * @param {PageItem} item - the item to check.
 * @returns {Boolean}
 */
GraphBar.is = function is(item) {
    return undefined != GraphBar.getContainer(item);
};

/**
 * Returns a container of rectangles.
 * If no bars are found, returns undefined.
 * @param {PageItem} item - the item to search.
 * @returns {PageItem?} - the container.
 */
GraphBar.getContainer = function getContainer(item) {

    var container;

    if (item.rectangles[0].isValid)
        container = item;

    else if (
        item.groups[0].isValid
        && item.groups[0].rectangles[0].isValid
    )
        container = item.groups[0];

    return container;

};

/**
 * Returns array of `count` bar elements.
 * Adds or removes elements as necessary.
 * @author m1b
 * @version 2024-08-15
 * @param {Number} count - the number of elements desired.
 * @returns {Array<Polygon>}
 */
GraphBar.prototype.getElements = function getElements(count) {
    var self = this;
    return getElementsOfContainer(self.container, 'rectangles', count);
};

/**
 * Adjusts the bar according to `value`;
 * @author m1b
 * @version 2024-08-14
 * @param {Number|Array<Number>} values - the graph value(s).
 */
GraphBar.prototype.setValue = function setValue(values) {

    var self = this;

    if ('Number' === values.constructor.name)
        values = [values];

    var max = 1 === values.length ? self.max || 100 : sum(values),
        min = 1 === values.length ? self.min || 0 : 0;

    // adjust the bars to match the values
    var b = self.bounds,
        width = b[3] - b[1],
        height = b[2] - b[0],
        vertical = width < height;

    var elements = self.getElements(values.length);

    // adjust the bar sizes
    for (var i = 0, adv = 0, value, bb, start = 0, end; i < elements.length; i++) {

        value = 1 === values.length ? values[i] : Math.abs(values[i]);

        if (
            i >= values.length
            || 0 === values[i]
        ) {
            // unused element, move it out of the way
            elements[i].geometricBounds = [0, 0, 1, 1];
            continue;
        }

        start = getScaleFactor(max, min, adv) * (vertical ? height : width);
        end = getScaleFactor(max, min, value + adv) * (vertical ? height : width);

        if (vertical) {
            bb = [
                b[2] - Math.max(start, end),
                b[1],
                b[2] - Math.min(start, end),
                b[3],
            ];

            adv += value;
        }

        else {
            bb = [
                b[0],
                b[1] + Math.max(start, end),
                b[2],
                b[1] + Math.min(start, end),
            ];

            adv += value;
        }

        elements[i].geometricBounds = bb;

    }

};

/**
 * A graph line element.
 * @author m1b
 * @version 2024-08-16
 * @constructor
 * @param {PageItem} item - an item containing an open path.
 * @returns {GraphLine}
 */
function GraphLine(item) {

    var self = this;
    self.item = item;
    self.container = GraphLine.getContainer(item);
    self.isValid = undefined != self.container;

    if (!self.isValid)
        return;

    self.bounds = self.item.geometricBounds;
    self.line = self.container.polygons[0];

    // check labels for key/value pairs
    var data = parseKeyValues(
        item.label + ';'
        + item.parent.parentTextFrames[0].label
    );

    // whether to flip the data axis
    self.flip = getAsNumber(data.flip);

    // value range
    self.max = getAsNumber(data.max, 100);
    self.min = getAsNumber(data.min, 0);

    // force vertical
    self.lineCount = getAsNumber(data.lineCount, 1);

    // size of the leading and trailing sections of the line
    self.nubSize = getAsNumber(data.nubSize, 5);

    // orientation of line
    self.vertical = getAsBoolean(data.vertical, undefined);

    if (data.horizontal)
        self.vertical = false;

    // whether to flip the data axis
    self.flip = getAsBoolean(data.flip);

    // whether the line is to be filled
    self.filled = getAsBoolean(data.filled);

};

/**
 * Returns true if the item meets
 * the criteria to be a GraphLine.
 * @param {PageItem} item - the item to check.
 * @returns {Boolean}
 */
GraphLine.is = function is(item) {
    return undefined != GraphLine.getContainer(item);
};

/**
 * Returns a container of polygons.
 * If no lines are found, returns undefined.
 * @param {PageItem} item - the item to search.
 * @returns {PageItem?} - the container.
 */
GraphLine.getContainer = function getContainer(item) {

    var container;

    if (item.polygons[0].isValid)
        container = item;

    else if (
        item.groups[0].isValid
        && item.groups[0].polygons[0].isValid
    )
        container = item.groups[0];

    if (
        container
        && container.polygons[0].paths.length > 0
        && PathType.OPEN_PATH === container.polygons[0].paths[0].pathType
    )
        return container;

};

/**
 * Returns array of `count` line elements.
 * Adds elements to make up `count` if necessary.
 * @author m1b
 * @version 2024-08-15
 * @param {Number} count - the number of elements desired.
 * @returns {Array<Polygon>}
 */
GraphLine.prototype.getElements = function getElements(count) {
    var self = this;
    return getElementsOfContainer(self.container, 'polygons', count);
};

/**
 * Adjusts the line according to `values`;
 * @author m1b
 * @version 2024-09-04
 * @param {Number|Array<Number>} values - the graph value(s).
 */
GraphLine.prototype.setValue = function setValue(values) {

    var self = this;

    if ('Number' === values.constructor.name)
        values = [values];

    if (values.length < 2)
        // not enough values to draw line
        return;

    var max = undefined == self.max ? Math.max.apply(null, values) : self.max,
        min = undefined == self.min ? Math.min.apply(null, values) : self.min,
        flip = self.flip === true;

    var b = self.bounds.slice(),
        width = b[3] - b[1],
        height = b[2] - b[0],
        vertical = undefined != self.vertical
            ? self.vertical
            : width < height;

    var lines = self.getElements(self.lineCount),
        valuesPerLine = Math.ceil(values.length / self.lineCount),
        step = (vertical ? height : width) / (valuesPerLine - 1);

    // adjust the lines
    for (var i = 0, adv, points; i < lines.length; i++) {

        adv = 0;
        points = [];

        for (var j = 0, p, value; j < valuesPerLine; j++) {

            value = values[i * valuesPerLine + j];

            // calculate the point on the data axis
            p = getScaleFactor(max, min, value) * (vertical ? width : height);

            if (vertical) {
                points.push(flip
                    ? [b[3] - p, b[0] + adv]
                    : [b[1] + p, b[0] + adv]
                );
            }
            else {
                points.push(flip
                    ? [b[1] + adv, b[0] + p]
                    : [b[1] + adv, b[2] - p]
                );
            }

            adv += step;

        }

        // add a little nub at both ends
        if (vertical) {
            points.unshift([points[0][0], points[0][1] - self.nubSize]);
            points.push([points[points.length - 1][0], points[points.length - 1][1] + self.nubSize]);
        }

        else {
            points.unshift([points[0][0] - self.nubSize, points[0][1]]);
            points.push([points[points.length - 1][0] + self.nubSize, points[points.length - 1][1]]);
        }

        if (self.filled) {

            // add points at both ends to "fill" the line
            var overshoot = 5,
                h = flip ? b[0] - overshoot : b[2] + overshoot,
                v = flip ? b[3] + overshoot : b[1] - overshoot;

            if (vertical) {
                points.unshift([v, points[0][1]]);
                points.push([v, points[points.length - 1][1]]);
            }

            else {
                points.unshift([points[0][0], h]);
                points.push([points[points.length - 1][0], h]);
            }

        }

        // adjust the line to match the values
        lines[i].paths[0].entirePath = points;

    }

};

/**
 * A graph pie element.
 * @author m1b
 * @version 2024-08-14
 * @constructor
 * @param {PageItem} item - an item containing a polygon.
 * @returns {GraphPie}
 */
function GraphPie(item) {

    var self = this;
    self.item = item;
    self.container = GraphPie.getContainer(item);
    self.isValid = undefined != self.container;

    if (!self.isValid)
        return;

    self.bounds = item.geometricBounds;

    // check labels for key/value pairs
    var data = parseKeyValues(
        item.label + ';'
        + item.parent.parentTextFrames[0].label
    );

    // value range
    self.max = getAsNumber(data.max, 100);
    self.min = 0;

    // the angle of the first slice
    self.startAngle = getAsNumber(data.startAngle, 0);

    // how far the radius overshoots the container bounds
    self.overshoot = getAsNumber(data.overshoot, undefined);

};

/**
 * Returns true if the item meets
 * the criteria to be a GraphPie.
 * @param {PageItem} item - the item to check.
 * @returns {Boolean}
 */
GraphPie.is = function is(item) {
    return undefined != GraphPie.getContainer(item);
};

/**
 * Returns a container of slice polygon(s).
 * If no slices are found, returns undefined.
 * @param {PageItem} item - the item to search.
 * @returns {PageItem?} - the container.
 */
GraphPie.getContainer = function getContainer(item) {

    var container;

    if (item.polygons[0].isValid)
        container = item;

    else if (
        item.groups[0].isValid
        && item.groups[0].polygons[0].isValid
    )
        container = item.groups[0];

    if (
        container
        && container.paths.length > 0
        && PathType.CLOSED_PATH === container.polygons[0].paths[0].pathType
    )
        return container;

};

/**
 * Returns array of `count` pie slice elements.
 * Adds elements to make up `count` if necessary.
 * @author m1b
 * @version 2024-08-15
 * @param {Number} count - the number of elements desired.
 * @returns {Array<Polygon>}
 */
GraphPie.prototype.getElements = function getElements(count) {
    var self = this;
    return getElementsOfContainer(self.container, 'polygons', count);
};

/**
 * Adjusts the inner polygon(s) of
 * the GraphPie to show pie slices.
 * @author m1b
 * @version 2024-08-15
 * @param {Number|Array<Number>} values - the graph value(s).
 */
GraphPie.prototype.setValue = function setValue(values) {

    var self = this;

    if ('Number' === values.constructor.name)
        values = [values];

    var max = 1 === values.length ? 100 : sum(values),
        angles = [];

    // calculate angle for each value
    for (var i = 0, value; i < values.length; i++) {
        value = Math.max(0, values[i]);
        angles.push(value / max * 360);
    }

    var b = self.bounds,
        centerX = (b[1] + b[3]) / 2,
        centerY = (b[0] + b[2]) / 2,
        radius = (b[3] - b[1]) / 2;

    // add overshoot, default 10%
    radius += (self.overshoot ? self.overshoot : radius * 0.1);

    var slices = self.getElements(angles.length);

    // adjust the pie slices
    for (var i = 0, start = self.startAngle; i < slices.length; i++) {

        if (
            i >= values.length
            || 0 === values[0]
        ) {
            // unused element, move it out of the way
            slices[i].paths[0].entirePath = [[b[0], b[1]], [b[0], b[1]]];
            continue;
        }

        var end = (start + angles[i]),
            startRad = start * Math.PI / 180,
            endRad = end * Math.PI / 180;

        var allAnglesRad = interpolateRange(startRad, endRad, Math.floor((end - start) / 45));

        var points = [[centerX, centerY]];

        for (var j = 0; j < allAnglesRad.length; j++)
            points.push([
                centerX + radius * Math.cos(allAnglesRad[j]),
                centerY + radius * Math.sin(allAnglesRad[j]),
            ]);

        // set the polygon's path
        slices[i].paths[0].entirePath = points;

        // ready for next slice
        start = end;

    }


};

/**
 * Returns an array including `count` interpolated
 * values between `start` and `end`, inclusive.
 * @param {Number} start - the first value.
 * @param {Number} end - the last value.
 * @param {Number} count - the number of interpolations.
 * @returns {Array<Number>}
 */
function interpolateRange(start, end, count) {

    var range = [start],
        step = (end - start) / (count + 1);

    for (var i = 1; i <= count; i++)
        range.push(start + i * step);

    range.push(end);

    return range;

};

/**
 * Returns the closest anchored object found near the given text.
 * @param {Text} text - the text associated with the graph element.
 * @param {Number} [buffer] - the search distance, in characters, around the text (default: 5).
 * @returns {GraphBar|GraphPie?}
 */
function getNearestGraphElement(text, buffer) {

    // look at chars on either side of value
    buffer = buffer || 5;

    // search around the text for graph elements
    for (var i = 1; i <= buffer; i++) {

        var start = Math.max(text.characters[0].index - i, 0),
            end = Math.min(text.characters[-1].index + i, text.paragraphs[0].characters[-1].index),
            textRange = text.parentStory.characters.itemByRange(start, end).getElements()[0],
            items = textRange.pageItems.everyItem().getElements(),
            item = undefined;

        while (items.length) {
            if (items[0].isValid) {
                item = items[0];
                break;
            }
            items.shift();
        }

        if (!item)
            continue;

        if (GraphBar.is(item))
            return new GraphBar(item);

        else if (GraphLine.is(item))
            return new GraphLine(item);

        else if (GraphPie.is(item))
            return new GraphPie(item);

    }

};

/**
 * Main script:
 *   1. Find graph values using `settings`.
 *   2. Find associated graph element (pie and bar)
 *      for each number (or number group)
 *   3. Adjust the graph elements to match the values.
 */
function main() {

    // expand search by number of characters on either size of graph values text
    const SEARCH_DISTANCE = 2;

    // any non-digit character
    const VALUE_DELIMITER = /[^\d,\.\|-]/g;

    // reset all graph elements to this value
    const RESET_VALUE = 0;

    if (0 === app.documents.length)
        return alert('Please open a document and try again.');

    var doc = app.activeDocument,
        counter = 0;

    app.scriptPreferences.measurementUnit = MeasurementUnits.POINTS;
    app.findGrepPreferences = NothingEnum.NOTHING;
    app.findGrepPreferences.findWhat = settings.findWhat;

    if (settings.searchProperties)
        app.findGrepPreferences.properties = settings.searchProperties;

    var targets = doc.selection.length > 0 ? doc.selection : [doc],
        target
    done = {};

    while (target = targets.pop()) {

        if ('InsertionPoint' === target.constructor.name)
            // we want the story
            target = target.parent;

        if (
            target.hasOwnProperty('id')
            && done[target.id]
        )
            // already done
            continue;

        if (
            'Character' === target.parent.constructor.name
            && 'TextFrame' !== target.constructor.name
        )
            // might be an anchored graph element
            target = target.parent.parent;

        else if ('InsertionPoint' === target.constructor.name)
            // we want the story
            target = target.parent;

        else if ('Text' === target.constructor.name)
            // add any anchored text frames
            targets = targets.concat(target.textFrames.everyItem().getElements());

        if ('TextFrame' === target.constructor.name)
            // add any anchored text frames
            targets = targets.concat(target.textFrames.everyItem().getElements());

        if (!target.hasOwnProperty('findGrep'))
            // can't use this
            continue;

        done[target.id] = true;

        // find the graph values
        found = target.findGrep();

        for (var i = 0, text, nums, values, element; i < found.length; i++) {

            text = found[i];
            element = getNearestGraphElement(text, SEARCH_DISTANCE);

            if (!element)
                continue;

            // parse the number(s)
            values = [];
            nums = text.contents.split(VALUE_DELIMITER);

            for (var j = 0, num; j < nums.length; j++) {

                num = settings.reset ? RESET_VALUE : parseFloat(nums[j]);

                if (!isNaN(num))
                    values.push(num);

            }

            // adjust the graph element
            element.setValue(values);
            counter++;

        }

    }

    if (settings.showResults)
        alert('Updated ' + counter + ' graph elements.');

};
app.doScript(main, ScriptLanguage.JAVASCRIPT, undefined, UndoModes.ENTIRE_SCRIPT, 'Update Graph Elements');


/**
 * Returns an array of `count` page items
 * of `typePlural` found in `container`.
 * Will add elements if necessary.
 * @author m1b
 * @vesion 2024-08-15
 * @param {Page Item} container - the container of the elements, eg. Rectangle.
 * @param {String} typePlural - the key to the page items, eg. "rectangles".
 * @param {Number} count - the number of elements desired.
 * @returns {Array<*>}
 */
function getElementsOfContainer(container, typePlural, count) {

    count = count || 1;

    if (!container.hasOwnProperty(typePlural))
        throw Error('getElementsOfContainer: bad `typePlural` supplied.');

    // create elements if necessary
    for (var i = 0; i < count; i++)
        if (!container[typePlural][i].isValid)
            container[typePlural].add();

    return container[typePlural].everyItem().getElements();

};


/**
 * Returns sum of numbers.
 * @param {Array<Number>} arr - the numbers to sum.
 * @returns {Number}
 */
function sum(arr) {

    var total = 0;

    for (var i = 0; i < arr.length; i++)
        total += arr[i];

    return total;

};

/**
 * Returns `str` as a Number, or `defaultNum` if fails.
 * @param {String} str - the number to coerce from string.
 * @param {Number} [defaultNum] - if coercing fails, return this (default: undefined).
 * @returns {Number?}
 */
function getAsNumber(str, defaultNum) {

    var num = Number(str);
    return isNaN(num) ? defaultNum : num;

};

/**
 * Returns `str` as a Boolean;
 * @param {String} str - the bolean to coerce from string.
 * @param {*} [defaultValue] - if coercing fails, return this (default: undefined).
 * @returns {Boolean}
 */
function getAsBoolean(str, defaultValue) {

    if (
        undefined == str
        || '' == str
    )
        return defaultValue;

    var num = Number(str);

    if ('true' === str.toLowerCase())
        return true;
    else
        return !isNaN(num) && num > 0;

};

/**
 * Returns the scale factor of `n` between `min` and `max`.
 * @param {Number} max - the maximum value.
 * @param {Number} min - the minimum value.
 * @param {Number} n - the value to be scaled.
 * @returns {Number}
 */
function getScaleFactor(max, min, n) {

    return (n - min) / (max - min);

};

/**
 * Returns an object populated by
 * key/value pairs parsed from `str`.
 *
 * Example:
 *   parseSimpleData('max:250;min:-25');
 *
 *   returns this object:
 *     {
 *        'max':'250',
 *        'min':'-25',
 *     }
 *
 * @author m1b
 * @version 2024-08-17
 * @param {String} str - the string to parse.
 * @returns {Object}
 */
function parseKeyValues(str) {

    const END_OF_KEY_CHAR = ':',
        END_OF_VALUE_CHAR = ';',
        MATCH_KEY_VALUE = new RegExp('(?^|\\n|' + END_OF_VALUE_CHAR + '\\s*)([a-z]+)\\s*' + END_OF_KEY_CHAR + '\\s*([^' + END_OF_VALUE_CHAR + ']+)\\s*', 'ig');

    var results = {},
        match;

    while (match = MATCH_KEY_VALUE.exec(str))
        if (3 === match.length)
            results[match[1]] = match[2];

    return results;

};
Edit 2024-08-16: fixed bug where GraphPie didn't check its parent text frame's label.
Edit 2024-08-18: improved code a bit here and there, added support for line graphs, and updated documentation and attached demo.indd.
Edit 2024-09-04: fixed bug in GraphLine.prototype.setValue.