Bed30321077z973
Inspiring
August 12, 2025
Answered

What's happening? I could not run ExtendScript anymore????

  • August 12, 2025
  • 1 reply
  • 657 views

Hello

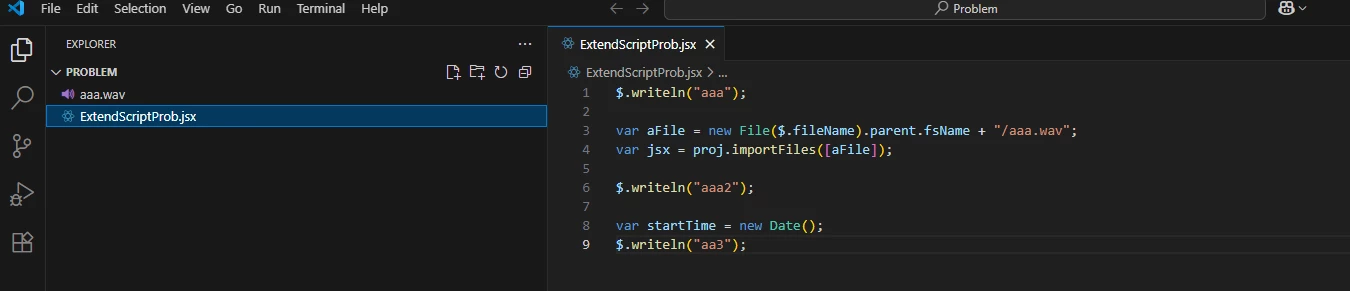
Here is a very simple script:

$.writeln("aaa");

var aFile = new File($.fileName).parent.fsName + "/aaa.wav";
var jsx = proj.importFiles([aFile]);

$.writeln("aaa2");

var startTime = new Date();
$.writeln("aa3");
 
I am running it, but nothing is happening? It was working yesterday:
Screenshots:


The folder where visual code is open:


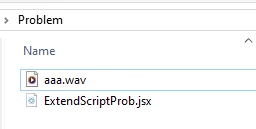
You can see the file is there.

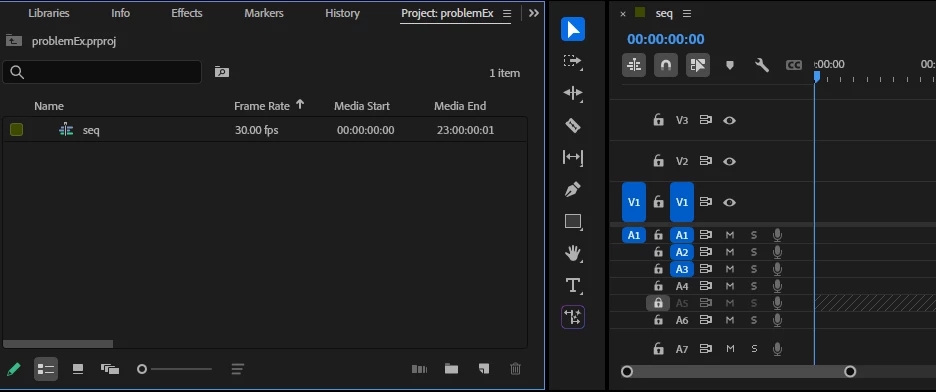
And finally PPRO right after running the code (and seeing no prints for the first time it happen to me)

nothing happened:


Please tell me what is wrong!


At visual code level I see the usual eval, but only for a split second then it disapears and as i said nothing happened, no prints inside terminal/debug console (from $.writeln() lines) and no effect on current opened ppro project:

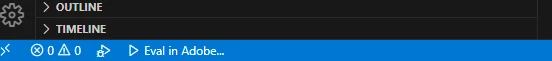
(This dissapears in seconds)


I need PPRO scripting thought ExtendScript, I have been working on this workflow for 1-2 years (you might recognize my name from last year), everything was working fine up to today.


Is there a problem?

 (Only thing I did was to save AS (new name) a current project on PPRO while visual code was open, but again I restarted ppro and visual code several times, even restarted pc)
 
Correct answer Bruce Bullis

So @Bruce Bullis ? problem still persisting 😞


>I am not used to seeing these blue buttons.

From the screenshots you've it appears that your current VSCode project contains no debugging configurations; this would prevent successful debugging. Are you attempting to execute your local .jsx from within a different directory, than the one from within which it previously worked? 

You're not making any QE DOM calls, so app.enableQE() doesn't do anything, nor does it use the active sequence, so I'm not sure why they'd be relevant...

Do you have the latest ExtendScript debugger installed? If so, you can use VSCode's "Run --> Add Configuration..." to add one. 

Here's my local "Run a script named test.jsx, in PPro beta" configuration:

{
"type": "extendscript-debug",
"request": "launch",
"name": "Beta",
"hostAppSpecifier": "premiereprobeta-25.0",
"script": "~/estk/test.jsx",
},


I open my "~/estk" directory in VSCode, select the Debug button (from the left edge of the VSCode screen), then "Run --> Start Debugging". 


1 reply

Bruce Bullis
Community Manager
Community Manager
August 12, 2025

>...everything was working fine up to today.

What, in your development environment, changed between today, and the last time you were able to launch and debug ExtendScript in PPro?

Bed30321077z973
Inspiring
August 12, 2025

Hello @Bruce Bullis I am glad you are here in august maybe we can resolve this quickly.

To answer your question: almost nothing. The only thing that happened was that:

1) I opened my PPRO project, that had responded well to visual code.

2) I opened my Visual code with extend script that was working fine the day before and interacted well with PPRO (mostly sending commands such as importing files etc)

3) THIS TIME: I did a "Save As" , and the project changed name. Then I deleted some imported items to retry the import (I am doing lot of experiments with that). Just before running my code again.


I am wondering if when Visual code was set up, it had "connected or registered" a specific PPRO project opened, and the SAVE AS, somehow disturbed the connection or something like that.

I went back to all my previous projects that worked this week and week before: none response to the code I shared anymore.

When I run the code and select extendcode (start debugging -> Launch--> PPRO), it shows that blue "Eval" icon for a split second then stops, and it shows this  on the left:


I am not used to seeing these blue buttons.

usually the EVAL blue icon or even blue line at the bottom STAYS and a button to HALT the run is available.

Well not this time, it just stops within splits of seconds and none of the code was/is run, since no print appears in no terminal nor debug console.

Are there some logs we can look at or anything we could do?


NOTICE THAT: I don't get an error when selecting debbuging -->... --> PPRO. (I would get an error if I select "Adobe media Encoder" since it is not open). But yeah PPRO is open and no error happen, but also the code is not run anyway so that's weird? (I just tested, I closed PPRO and run the code and the error saying it is not open shows up correctly).


What can we do?

Thanks


Bed30321077z973
Inspiring
August 12, 2025

OK I modified the code (it was a code i made to show the problem I had but I had forgotten some important initiations), here it is:

app.enableQE();
var proj = app.project;

var activSeq = proj.activeSequence;

$.writeln("aaa");

var aFile = new File($.fileName).parent.fsName + "/aaa.wav";
var jsx = proj.importFiles([aFile]);

$.writeln("aaa2");

var startTime = new Date();
$.writeln("aa3");

Now the Eval bar shows up:


(It no longer shows up actually, after few experiments bewteen writing this and trying to reproduce)

Even when the blue bar showed up (meaning the code was still running), no print showed up on output or debug console or anywhere, and no file was imported to the project!!