

How do I go about making an interactive graph
Hi,
I am completely new to adobe so what I am asking may be very, very simple to do. I'm wanting to create an interactive graph for my group's website. I have attached the figure that I want to make interactive. I have two ways in which I may want to present it. So, when a person clicks on treatment 'A', the bar will shoot up to 70% (so it is animated - so you can see it slide up to the 70% mark) and remain there even if the person was to click on treatment D etc and not disappear.
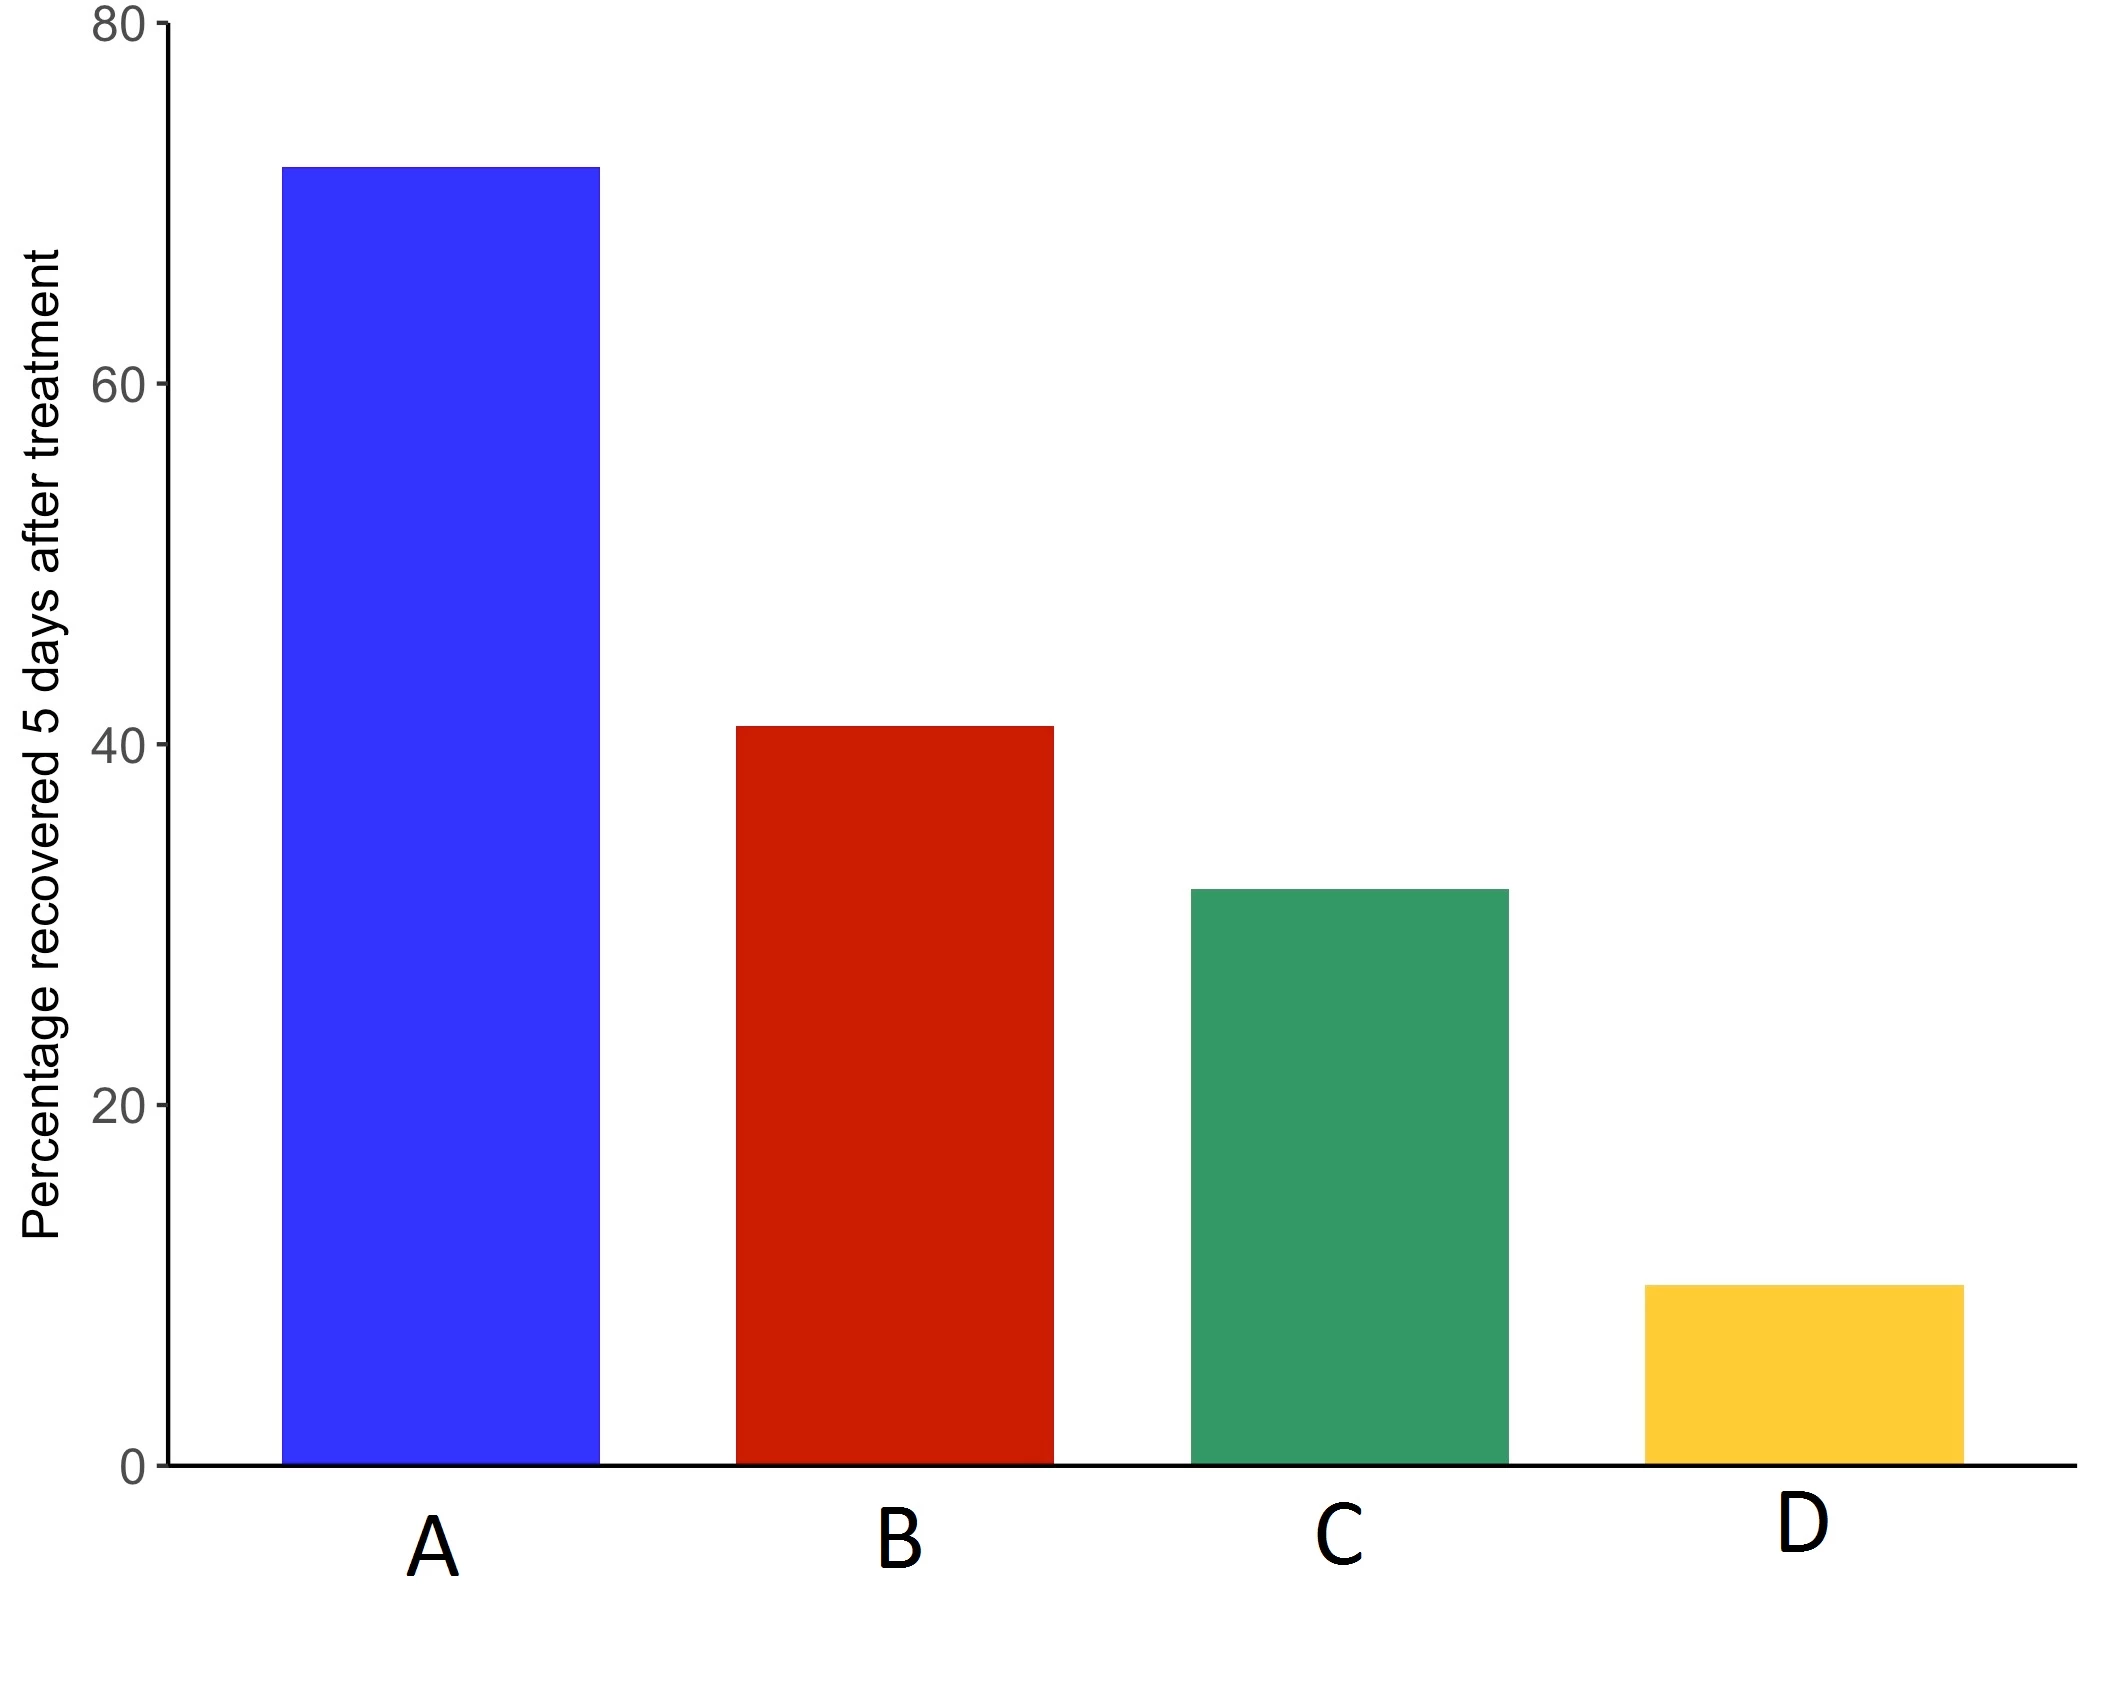
So just a background info about the study, this shows the different treatments (A-D) and the % of sheep to recover from a disease. Our main audience is to reach out to students. So we were thinking of another way of presenting it, maybe putting pictures of diseased sheep (on a high transparency level) and then when you click on e.g. treatment C, 30% of the diseased sheep will look healthy/normal. I have a sketched out drawing to illustrate this below where the circles represent diseased sheep. The triangle and change in colour represents healthy sheep. And again, once you click on one treatment, it will remain there even when I click on another treatment group rather than like a button, it goes back to the original (if that makes sense). Also, I would like to have it animated where it will change from bottom upwards rather than it just appearing?

So my question is, how do I go about making these two interactive graphs? I have all the adobe products such as illustrator, after effects, animate etc. Sorry if it didn't make that much sense, but hopefully it did. Any help will be much appreciated!
Thank you so much for taking your time to read this!