

Cfchart bar scalefrom bars are below the xaxis and hide the xaxis labels
I recently updated to ColdFusion 2021 and I got almost everything working except for one chart that I am not sure how to resolve.
I am using scalefrom 99% to 100% to get a better view of the data. When the chart is plotted it colors the bars outside the internal graph area and overwrites the x-axis labels. I have included sample code and screen shots.
<cfset plot = { "value-box":{
"visible":true,
"placement":"top-in",
"font-color": "white"
}}>
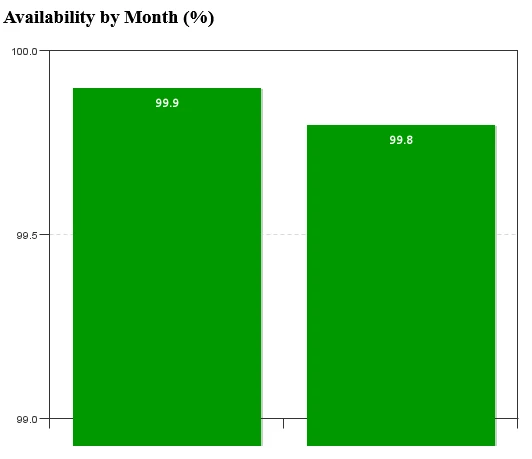
<h3>Availability by Month (%)</h3>
<cfchart chartheight="400" chartwidth="520" format="png" scalefrom="99" scaleTo="100" showlegend="no" plot="#plot#" >
<cfchartseries type="bar" datalabelstyle="value" seriescolor="##009900">
<cfchartdata item="Jan" value="99.9"/>
<cfchartdata item="Jan" value="99.8"/>
</cfchartseries>
</cfchart>
Result:
If I change the series type to area then it works correctly, but I want to use bars for this data.
eg
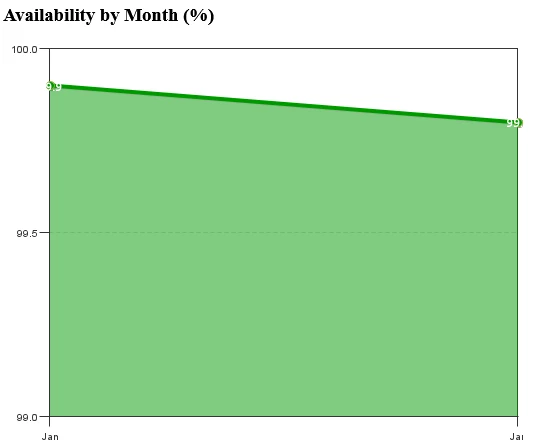
Is this a bug that I will have to work around or is there a way to handle this that I am unaware of?