Inspiring
October 25, 2023
Question

CFCHART - Move labels or change color

  • October 25, 2023
  • 1 reply
  • 1368 views

(CF2016)


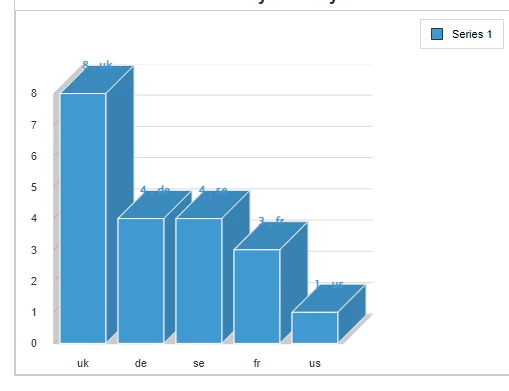
I am using CFCHART and have a problem with the labels, making it difficult to read the data

a) Text being in the same color as the bar

b) Sitting too close to the bars


Could anybody help me with either changing the colour (not sure that will help) and preferably moving the text further up so it sits on its own. Code and screenshot below.


On another note, the defaul is a very nice looking blue gradient, but text was also light on pie and bar and extremely difficult to read, can anybody help with making it a gradient of the colour I have?

Thanks


<cfchart
title="Revenue"
format="html"
show3d="yes"
showlegend="yes"
chartheight="400"
chartwidth="500"
labelFormat = "number"
showborder="true"
pieSliceStyle="sliced"
sortXAxis = "yes">

<cfchartseries type="bar" dataLabelStyle="pattern" seriescolor="4199d1" QUERY="GetRevenue" valuecolumn="totalrevenue" itemcolumn="revenue_country">
</cfchartseries>

</cfchart>

    This topic has been closed for replies.

    1 reply

    BKBK
    Community Expert
    October 29, 2023

    Under the bonnet ColdFusion uses Zingchart to display charts. The text that you see at the top of the bars comes from Zingchart's Value-Box attribute for a chart series.  


    When ColdFusion implemented Zingchart, the developers hard-coded the value of the Value-Box attribute. This looks pretty much okay for a non-3D chart. That is, for bar charts with


    show3d="no"


    However, for 3D bar charts, the extra dimension creeps into Value-Box's space. Apparently, ColdFusion's developers hadn't anticipated that.


    I would therefore suggest, at this point, that you file a bug report for this (3D bar chart) problem. 


    I have a possible workaround for you. Mind you, it is a bit dirty. 🙂 I say dirty because you have to interfere with ColdFusion's internal settings. So beware of the risk involved.


    Here goes.


    Open the (3D bar chart) in the browser. Press CTRL-U on the keyboard to display the page source. You should see in the Javascript a variable similar to the following:


    var jsonConfig32 = '{
        "graphset": [{
                "border-color": "#cccccc",
                "series": [{
                        "shadow": true,
                        "background-color-2": "#4199d1",
                        "value-box": {
                            "text": "%v , %k"
                        },
                        "values": [1, 3, 4, 4, 8],
                        "shadow-color": "#cccccc",
                        "type": "bar3d",
                        "shadow-blur-x": 2,
                        "background-color": "#4199d1",
                        "shadow-alpha": 1,
                        "shadow-blur-y": 1,
                        "marker": {
                            "background-color": "#4199d1",
                            "background-color-2": "#4199d1"
                        },
                        "shadow-distance": 2,
                        "line-color": "#4199d1"
                    }
                ],
                "scale-x": {
                    "line-color": "#cccccc",
                    "font-family": "Helvetica",
                    "item": {
                        "font-family": "Helvetica",
                        "color": "#333333",
                        "font-size": 11
                    },
                    "color": "#333333",
                    "label": {
                        "color": "#333333"
                    },
                    "bold": true,
                    "tick": {
                        "line-color": "#cccccc",
                        "size": 10,
                        "line-width": 1,
                        "line-gap-size": 0
                    },
                    "values": ["us", "fr", "se", "de", "uk"],
                    "guide": {
                        "line-width": 0
                    },
                    "line-width": 2,
                    "font-size": 16
                },
                "plot": {
                    "tooltip-text": "%v",
                    "hover-marker": {
                        "size": 3,
                        "background-color": "#888888"
                    },
                    "marker": {
                        "size": 3,
                        "background-color": "#cccccc"
                    },
                    "offset": 5,
                    "preview": true
                },
                "scale-y": {
                    "line-color": "#cccccc",
                    "font-family": "Helvetica",
                    "item": {
                        "font-family": "Helvetica",
                        "color": "#333333",
                        "font-size": 11
                    },
                    "format": "%v",
                    "color": "#333333",
                    "label": {
                        "color": "#333333"
                    },
                    "bold": true,
                    "tick": {
                        "line-color": "#cccccc",
                        "size": 10,
                        "line-width": 1,
                        "line-gap-size": 0
                    },
                    "line-width": 2,
                    "font-size": 16
                },
                "plotarea": {
                    "margin-right": 30,
                    "margin-top": 40,
                    "adjust-layout": true,
                    "margin-left": 70
                },
                "background-color": "white",
                "legend": {
                    "border-color": "#CCCCCC",
                    "item": {
                        "font-family": "Helvetica"
                    },
                    "margin-top": 40,
                    "adjust-layout": true,
                    "shadow": false,
                    "alpha": 1,
                    "background-color": "#FFFFFF",
                    "visible": "true"
                },
                "tooltip": {
                    "font-family": "Helvetica",
                    "color": "#FFFFFF",
                    "bold": true,
                    "padding": 5,
                    "font-size": 11
                },
                "3d-aspect": {
                    "x-angle": 60,
                    "true3d": false
                },
                "title": {
                    "border-color": "#cccccc",
                    "font-family": "Helvetica",
                    "adjust-layout": true,
                    "color": "#333333",
                    "bold": true,
                    "text": "Revenue",
                    "border-width": 1,
                    "wrap-text": true,
                    "font-size": 18,
                    "background-color": "white"
                },
                "border-width": 2,
                "type": "bar3d"
            }
        ]
    }';


    Those are the Zingchart configuration settings that ColdFusion uses internally to build your bar chart. As I said before, the setting that is causing you grief is Value-Box. It's value is currently


    "value-box": {"text": "%v , %k"}


    That setting is responsible for the text you see above the bars. So, we want to change the colour of the text and to shift the text just a little bit upwards. Or, in Zingchart terms, we want to give the Value-Box a font-color and a small negative value for offset-y. Something like:


    "value-box": {"text": "%v , %k","offset-y":-10,"font-color":"#be662e","font-weight":"bold"}


    You will notice that, for visual effect, I have chosen a font colour (#be662e) that is in direct contrast to the one you chose for the bars (#4199d1).


    The modified JSON is:


    {
        "graphset": [{
                "border-color": "#cccccc",
                "series": [{
                        "shadow": true,
                        "background-color-2": "#4199d1",
                        "value-box": {
                            "text": "%v , %k",
    						"offset-y":-10,
    						"font-color":"#be662e",
    						"font-weight":"bold"
                        },
                        "values": [1, 3, 4, 4, 8],
                        "shadow-color": "#cccccc",
                        "type": "bar3d",
                        "shadow-blur-x": 2,
                        "background-color": "#4199d1",
                        "shadow-alpha": 1,
                        "shadow-blur-y": 1,
                        "marker": {
                            "background-color": "#4199d1",
                            "background-color-2": "#4199d1"
                        },
                        "shadow-distance": 2,
                        "line-color": "#4199d1"
                    }
                ],
                "scale-x": {
                    "line-color": "#cccccc",
                    "font-family": "Helvetica",
                    "item": {
                        "font-family": "Helvetica",
                        "color": "#333333",
                        "font-size": 11
                    },
                    "color": "#333333",
                    "label": {
                        "color": "#333333"
                    },
                    "bold": true,
                    "tick": {
                        "line-color": "#cccccc",
                        "size": 10,
                        "line-width": 1,
                        "line-gap-size": 0
                    },
                    "values": ["us", "fr", "se", "de", "uk"],
                    "guide": {
                        "line-width": 0
                    },
                    "line-width": 2,
                    "font-size": 16
                },
                "plot": {
                    "tooltip-text": "%v",
                    "hover-marker": {
                        "size": 3,
                        "background-color": "#888888"
                    },
                    "marker": {
                        "size": 3,
                        "background-color": "#cccccc"
                    },
                    "offset": 5,
                    "preview": true
                },
                "scale-y": {
                    "line-color": "#cccccc",
                    "font-family": "Helvetica",
                    "item": {
                        "font-family": "Helvetica",
                        "color": "#333333",
                        "font-size": 11
                    },
                    "format": "%v",
                    "color": "#333333",
                    "label": {
                        "color": "#333333"
                    },
                    "bold": true,
                    "tick": {
                        "line-color": "#cccccc",
                        "size": 10,
                        "line-width": 1,
                        "line-gap-size": 0
                    },
                    "line-width": 2,
                    "font-size": 16
                },
                "plotarea": {
                    "margin-right": 30,
                    "margin-top": 40,
                    "adjust-layout": true,
                    "margin-left": 70
                },
                "background-color": "white",
                "legend": {
                    "border-color": "#CCCCCC",
                    "item": {
                        "font-family": "Helvetica"
                    },
                    "margin-top": 40,
                    "adjust-layout": true,
                    "shadow": false,
                    "alpha": 1,
                    "background-color": "#FFFFFF",
                    "visible": "true"
                },
                "tooltip": {
                    "font-family": "Helvetica",
                    "color": "#FFFFFF",
                    "bold": true,
                    "padding": 5,
                    "font-size": 11
                },
                "3d-aspect": {
                    "x-angle": 60,
                    "true3d": false
                },
                "title": {
                    "border-color": "#cccccc",
                    "font-family": "Helvetica",
                    "adjust-layout": true,
                    "color": "#333333",
                    "bold": true,
                    "text": "Revenue",
                    "border-width": 1,
                    "wrap-text": true,
                    "font-size": 18,
                    "background-color": "white"
                },
                "border-width": 2,
                "type": "bar3d"
            }
        ]
    }


    Remember the Javascript in the page source? ColdFusion obtains the value of the jsonConfig32 variable - which is a JSON - by parsing the file \cfusion\charting\styles\bar. The file doesn't have an extension and contains JSON.


    The workaround I am proposing involves temporarily replacing that file. The file is a system file. So, begin by creating a back-up of it. For example, by renaming it \cfusion\charting\styles\bar_BACKUP.


    Copy the "modified JSON" above to a text editor, and save it as the file \cfusion\charting\styles\bar. Remember NOT to use a file extension.


    If you now run your chart code, you should see something like:


    That's it.


    The workaround is meant to be temporary. It enables you to generate the best chart you can have. You could then create an image of the result for reuse.


     Remember that the workaround involves changing ColdFusion's internal setting. After you create the desired chart, and an image of it, you should revert to the bar file that you backed up. For example, by renaming \cfusion\charting\styles\bar to \cfusion\charting\styles\bar_CHANGED_VALUEBOX and \cfusion\charting\styles\bar_BACKUP to \cfusion\charting\styles\bar.  


    ACS LLCAuthor
    Inspiring
    November 2, 2023

    Many thanks for taking the time to provide the solution. It's going to be a feature I use all the time, so rather than a temp tweak, in my situation I'm best removing the 3D which is a shame. I just set it to NO for 3D and it display fine. Shame, the 3D does look better, but I think I'm best not messing with the configs.

    ACS LLCAuthor
    Inspiring
    November 2, 2023

    oh yes, I forgot about the bug report, I'll take care of that, although I'm on CF2016, so won't see a bug fix appear in my version 😞


    I have reported it as a bug. Feel free to vote for it 🙂


    https://tracker.adobe.com/#/view/CF-4219762