New Participant
July 10, 2024
Question

PROBLEMS WITH REQUEST TUNING CF2021

  • July 10, 2024
  • 4 replies
  • 3614 views

Dear

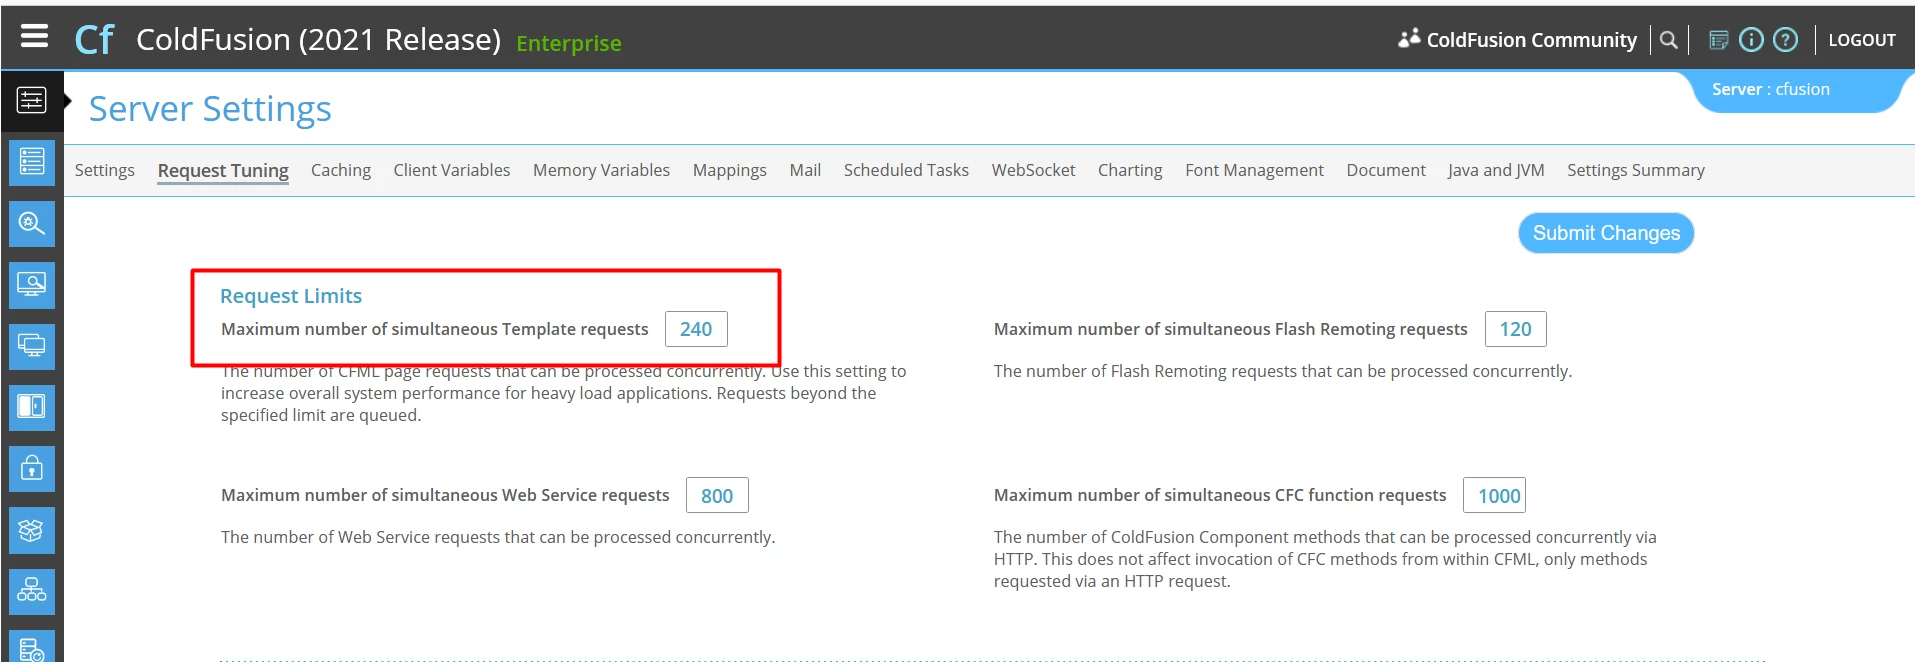
I have a server with Windows Server 2012 R2 and a CF 2021 in production, we have a problem with the request tunning configured on the server(240) that sometimes arrives to the maximum configured and the service goes down. Sometimes is necesary a restart the service for continues with the service.

The Datasource PostgreSQL configured on the client is configureded to Restrict connections to 210.
We had the same configurations implemented on a CF 2016 and a service of monitoring without problems.
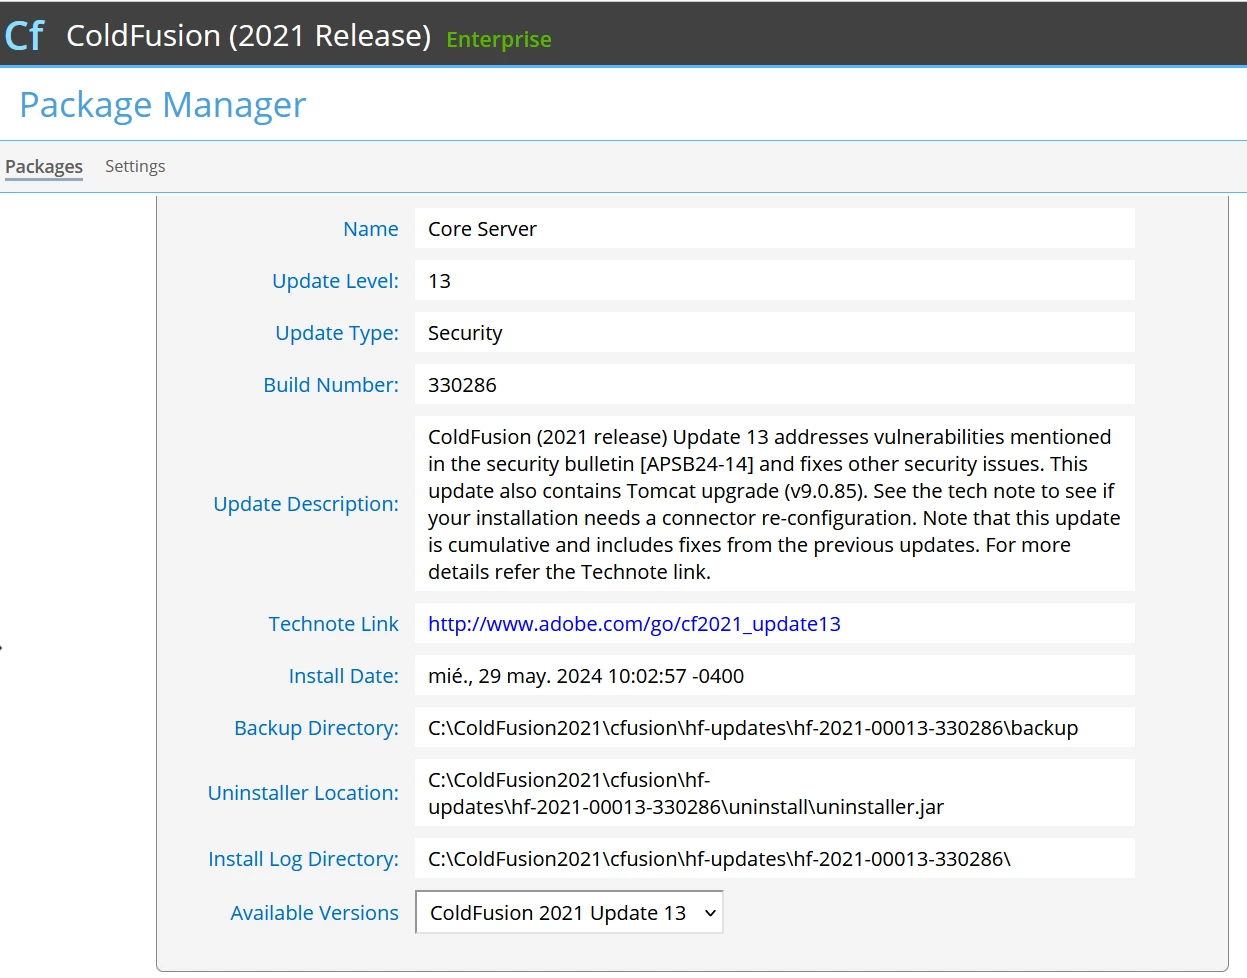
The update of CF2021 is the version 13, I attach a snapshot about that.
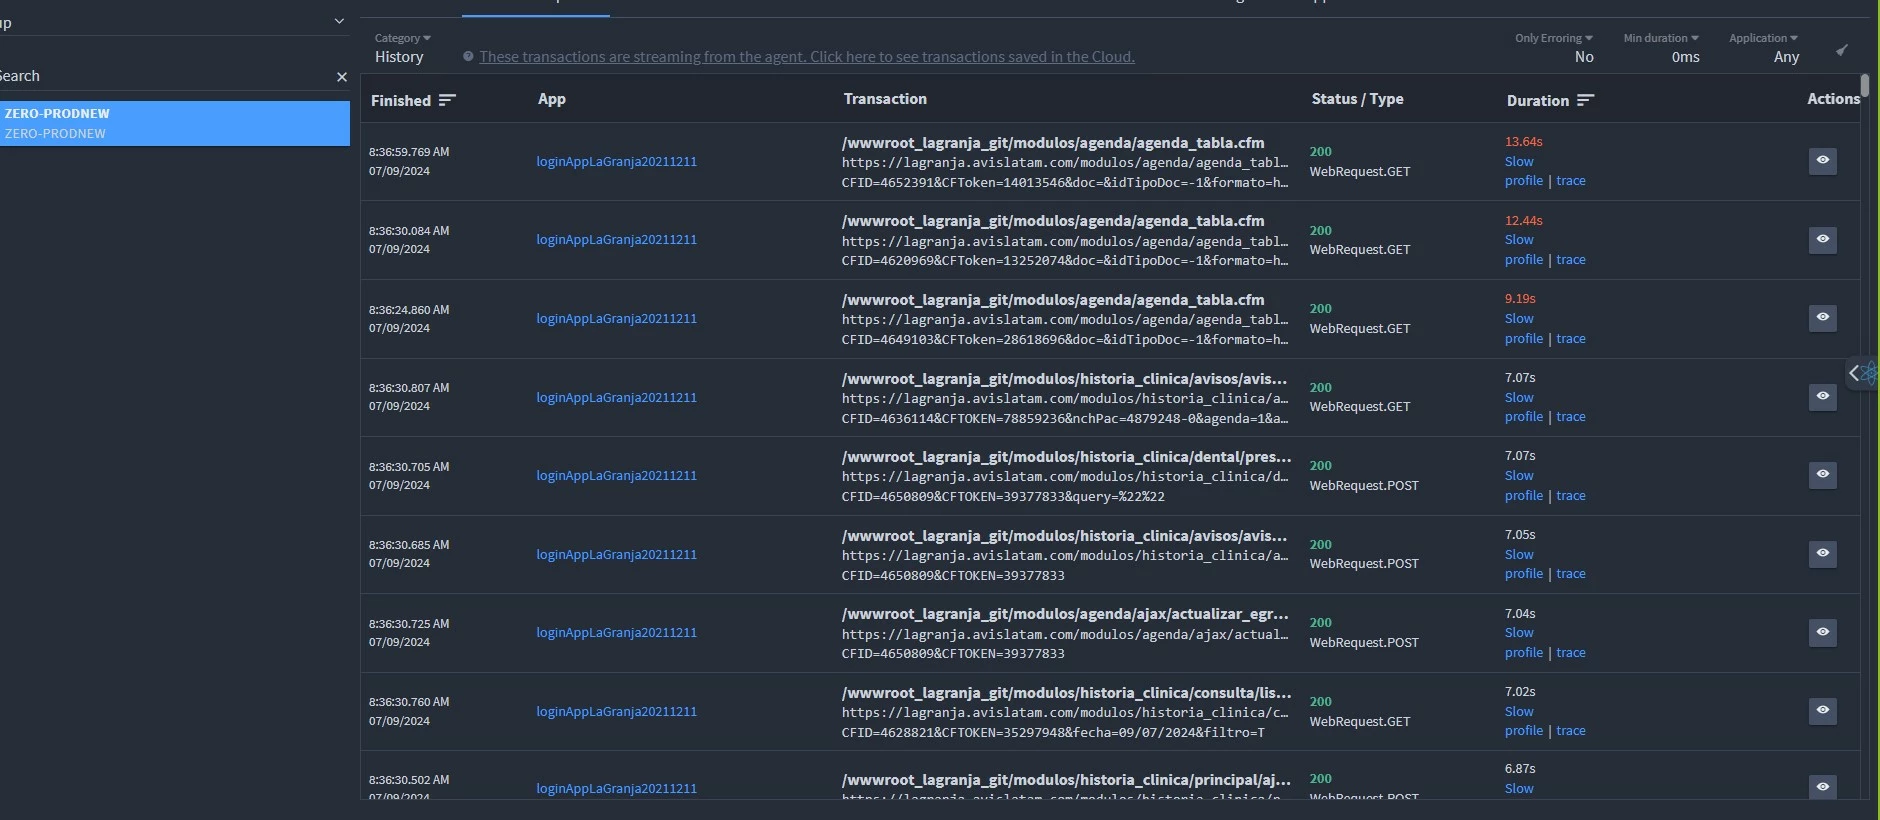
We activate a service of monitoring FusionReactor and the requests goes up until double or more of connections, so the system is very loaded and blocks easier.

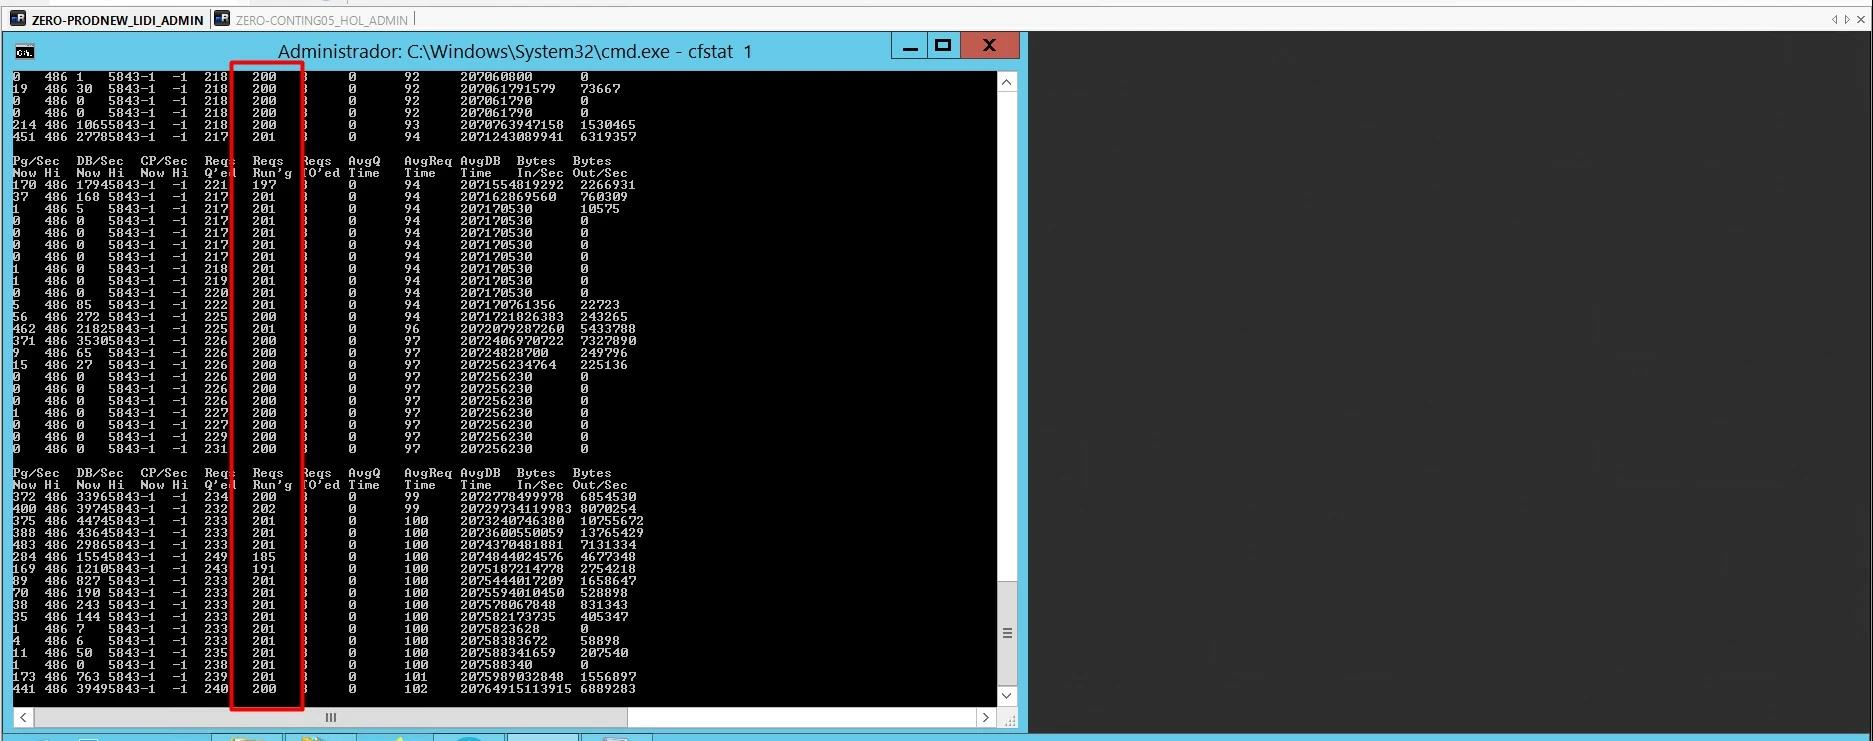
So we don't know what's happening we attach some snapshot about cfstat, FusionReactor and request tunning configured.


I hope you can help me
Best regards.


    4 replies

    New Participant
    August 7, 2024

    Good day.

    Before starting, I wanted to apologize for not responding earlier.

    I would like to comment that we have managed to stabilize the platform by making adjustments to the simultaneous Template requests parameter, we had it at 325 and now we set it to 350; we also made adjustments to the workers.properties and server.xml files, modifying the following values:


    workers.properties

    - worker.cfusion.max_reuse_connections: 1200

    - worker.cfusion.connection_pool_size: 8400


    server.xml

    - maxThreads: 8400

    Pic1


    Pic2


    Pic3


    As you can see in the screenshots, the tweaks helped keep the platform stable but currently we can only monitor using cfstat via a DOS window. Despite the apparent stability, we have episodes that can vary between 4 to 30 seconds where the active requests shoot up to the maximum and reach the maximum value set for the server, a screenshot of this is attached. (Pic2)

    We have times where active requests hang for more than 60 seconds, causing the entire system to not respond, we even lose access to the CF administrator portal, when this situation occurs the only way to correct it is to restart the CF service.

    The installation process of CF, PMT and FusionReactor was carried out without problems, however when PMT or FusionReactor are activated, the active requests begin to increase until they reach the configured limit, but this happens much faster and more often than when PMT or FusionReactor are not active.

    As mentioned before, we currently do not have any monitors active for our CF servers, the PMT and FusionReactor services are stopped and disabled, and if we activate them, the active requests are triggered and generate a service crash that forces us to restart the CF service.


    Now I'm going to answer the questions that I have been asked by BKBK, Dave and Charlie.


    Q: Second, how did you come up with those numbers for the CF request fit and database connection limits? Presumably they came from somewhere. The CF request adjustment limit seems to me terribly high. I would spend some time with a load test tool and see why those numbers are as high as they are.

    A: As Romina mentions, these parameters have been adjusted thanks to the experience of working with versions CF 8, CF 2016 and now CF 2021, in fact as can be seen above, we managed to stabilize the platform much more than it was at the worst moment of the incident.


    Q: It seems that you are using the US date format. In which time zone is your ColdFusion server located? And FusionReactor?

    A: MM/DD/YYYY is the format that you are using CF and FusionReactor with the timezone GMT-4, this configuration is the default and we have not modified CF or FusionReactor.


    Q: Your application is apparently memory intensive. So what is the server RAM and values in the java.args property in the jvm.config file of the ColdFusion application?

    A: The server has 256GB of RAM installed and has between 16GB and 64GB of RAM allocated, as seen in the parameters below

    java.args=-server  -Xms16384m -Xmx61440m --add-opens=java.rmi/sun.rmi.transport=ALL-UNNAMED --add-opens=java.base/java.nio=ALL-UNNAMED --add-opens=java.base/java.lang=ALL-UNNAMED --add-opens=java.base/sun.util.cldr=ALL-UNNAMED --add-opens=java.base/sun.util.locale.provider=ALL-UNNAMED --add-opens=java.base/java.net=ALL-UNNAMED --add-opens=java.base/java.io=ALL-UNNAMED -XX:+UseParallelGC -Djdk.attach.allowAttachSelf=true -Dcoldfusion.home={application.home} -Duser.language=en -Dcoldfusion.rootDir={application.home} -Dcoldfusion.libPath={application.home}/lib -Dorg.apache.coyote.USE_CUSTOM_STATUS_MSG_IN_HEADER=true -Dcoldfusion.jsafe.defaultalgo=FIPS186Random -Dorg.eclipse.jetty.util.log.class=org.eclipse.jetty.util.log.JavaUtilLog -Djava.util.logging.config.file={application.home}/lib/logging.properties -Dtika.config=tika-config.xml -Djava.locale.providers=COMPAT,SPI -Dsun.font.layoutengine=icu -Dcom.sun.media.jai.disableMediaLib=true -Dhttps.protocols=TLSv1.2 -Dcoldfusion.cpu.count=8 -Dcoldfusion.searchimplicitscopes=true -Dcoldfusion.classPath={application.home}/lib/updates,{application.home}/lib/,{application.home}/gateway/lib/,{application.home}/wwwroot/WEB-INF/cfform/jars,{application.home}/bin/cf-osgicli.jar


    Q: What is the value of "Queue Timeout Settings" (in the ColdFusion Administrator)?

    A: 560 seconds; this value was defined by the dev team, this is because we have processes that take a long time to be executed, according to what the dev team indicates this delay is normal. If for example, we lower this value to 60 seconds, timeout errors begin to be reported by system users.


    Q:Does your application use Application.cfc? If so what are the values for:

    A:

    sessionmanagement="Yes"

    clientmanagement="yes"

    sessiontimeout="#CreateTimeSpan(0,6,0,0)#"

    setclientcookies="true"

    the other values is undefined


    Q:Apparently, your application passes CFID and CFTOKEN in the URL. Is that how session is maintained in the application? Or is session maintained in a different way?

    A: Precisely, we keep the variables CFID and CFTOKEN in the URL


    Q:The application seems to receive an excessive number of requests per second. What is the average number of simultaneous users? Are any of them machines that send automatic requests to the application?

    A: The number of concurrent users occupying the system varies depending on the time of use and the platform, but the average maximum is 250 users per second and there's no an automatic machine that sends requests.


    Q:Your application is apparently memory-intensive?

    A: AVIS is not a memory-intensive application


    Thank you very much for your assistance and your responses.

    Best regards

    BKBK
    Community Expert
    August 9, 2024

    Hi @José38529857rmgv , thanks for answering our questions and for the additional information. I can already see possible ways to fine-tune the application. However, I have to finish my own project off before the end of this week.

    Expect suggestions from me this weekend. 

    New Participant
    August 9, 2024

    Hi @BKBK  thanks for your response, Hoping you are well, we will be attentive to your comments


    Regards

    BKBK
    Community Expert
    July 13, 2024

    @José38529857rmgv ,

    It is clear that your ColdFusion server and application need tuning. First, some questions I have, then some suggestions.


    Questions:

    (1) You seem to be using the US date format. In which time-zone is your ColdFusion server? And FusionReactor?

    (2) Your application is apparently memory-intensive. So what are the server RAM and the values in the java.args property in the jvm.config file of the ColdFusion application?

    (3) What is the value of "Queue Timeout Settings" (in the ColdFusion Administrator)?

    (4) You had problems installing both ColdFusion's Performance Monitoring Toolset (PMT) and FusionReactor.  (You say, "if we activate any monitoring tool the service fails"). These are two independent applications.. That suggests there is likely a fault in your ColdFusion installation. What errors or issues (in detail) did you encounter when you tried to install PMT and FusionReactor? 

    (5) Does your application use Application.cfc? If so what are the values for:
    this.sessionManagement

    this.clientManagement
    this.clientStorage
    this.sessionTimeout
    this.setClientCookies
    this.setDomainCookies

    (6) Apparently, your application passes CFID and CFTOKEN in the URL. Is that how session is maintained in the application? Or is session maintained in a different way?

    (7) The application seems to receive an excessive number of requests per second. What is the average number of simultaneous users? Are any of them machines that send automatic requests to the application?


    Suggestions:

    (a) To understand why the application worked smoothly with ColdFusion 2016, but not with ColdFusion 2021, you have to compare like with like. ColdFusion 2016 had all the required packages installed. So the first thing to do is to make sure all the packages in ColdFusion 2021 are installed. The steps to do so are as follows:

    1.  Open the command prompt (CMD) as administrator;
    2.  Use the DOS command CD to navigate to C:\ColdFusion2021\cfusion\bin;
    3.  Type cfpm.bat and press ENTER. That should bring up ColdFusion's Package Manager tool.
    4.  Type install all and press ENTER. When ColdFusion finishes, type quit and press ENTER.
    5.  Close the CMD window.
    6.  Restart ColdFusion 2021. 

    (b) Your application is apparently data-intensive and makes frequent connections to the database. Where the input remains the same, use cachedWithin to cache queries. That will significantly improve performance.

    (c) The application seems to read and write an excessive amount of data per second. You could improve performance by

    1.  caching frequently requested (unchanging) request and response data; 

    2.  enabling compression for data transfer, to reduce the amount of data sent over the network;

    3.  applying load balancing;

    4.  using asynchronous processing in your code, for example, by means of threads;

    5.  making use of the services of a Content Delivery Network to serve static files, thereby reducing the load on the web server.


    Charlie Arehart
    Community Expert
    July 13, 2024

    Can you share how you were able to conclude that "Your application is apparently memory-intensive"? It's certainly one of many common problems. I could have listed still more. I'm asking if you could help us all to see what suggested that specifically. 


    As for the rest, such back and forth reviewing these general things offered MAY luck out and strike gold, but the issue may well be still something else entirely. There are ways using fusionreactor (which he had already) to get that, but again going into detail here could get voluminous. Then there's his assertion of trouble upon using such tools (which should be resolvable).


    Jose, you never replied to my (or Dave's) responses. If you'll reply to bkbk's, I hope you'll at least offer some response to ours to let us know what you think. In the silence, we can infer anything.


    Finally, if you just want this problem solved, perhaps in less than an hour, my offer of a remote consulting session stands. Some challenges are hard to solve in forum threads but are far simpler in an online session--where we target your issue rather than elaborate back and forth here in a bunch of guesses, suggestions, explanations, questions, answers, clarifications, etc. Your call, of course.


    (And before anyone may carp back that I'm "always driving people to consulting to get answers", that's absolutely not true. By far in most of my replies here I make no mention of it. And in those I do, it's when I think it may help. Only rarely do I stress that it's  in my opinion the MOST effective option, as in this case.) 


    All 3 of us (Dave, BKBK, and me) are frequent contributors here. Often we're on the same page, sometimes we differ in opinions. Either way, we all do really just want to help. 

    /Charlie (troubleshooter, carehart. org)
    Community Expert
    July 12, 2024

    I'm going to throw some darts here. First, what happens if you turn off your monitoring service for a while?


    Second, how did you get to those numbers for CF request tuning and database connection limits? They presumably came from somewhere. The CF request tuning limit seems awfully high to me. I would spend some time with a load test tool and see why those numbers are as high as they are.


    Third, what happens when you try to optimize the slowest page as best you can? What part of that page is slower than the rest? You should be able to use CFTIMER to break the page into separate parts and see what's going on. My guess is that your database query is really slow when it presumably shouldn't be (I'm not going out on much of a limb there) but at least it's a start. Take that query and use whatever query analyzer PostgreSQL has, so you can figure out why it might get slow under load (no indexes, bad indexes, poorly-written SQL, poorly-designed DB structure for INSERT/UPDATE, poorly-designed DB structure for SELECT). This is an area where @Charlie Arehart or someone else can probably help you quickly.


    Dave Watts, Eidolon LLC

    Dave Watts, Eidolon LLC
    New Participant
    July 23, 2024

    Hello Dave, thanks for answer.  My name is Romina, and I work on the same team as Pedro, so I'll be addressing your questions.

    Firstly, the system operates smoothly when we do not use the monitoring service.

    Secondly, those numbers come from our experience. We've been using them for many years and have adjusted them based on server responses. However, we will review the CF request tuning limit since you mentioned it seems quite high. Is there a method you know to calculate it that isn't empirical?

    Thirdly, the pages do not show slowness, and the system functions well when we do not activate CF Reactor. We've spent the last three years optimizing queries, indices, etc., so I don't believe the issue lies there. We also recently validated this with an external DBA.

    Thank you very much for your assistance and your responses.

    Best regards,
    Romina

    New Participant
    July 23, 2024

    Dave, I apologize. In my response, I said Pedro, but I meant Jose.

    Charlie Arehart
    Community Expert
    July 11, 2024

    Jose, I'm afraid that nothing in your message or screenshots here will help us help you to resolve the problem. There's no single obvious setting change, and there's not even clarity about what requests were running. You show the fr cloud display of finished requests. That's not what's running at the time.  Even if you might assert those are ones which at least completed WHILE your cfstat shows many running, there were clearly many more running at the time than those you show. And in fact there may be ones running FAR longer than those, which we don't see here.


    In any case, you'd want to drill into the details of those you show, to find out WHY they were slow. I gather that's not something you feel competent to assess--and that's understandable. Most folks would not. 


    But I'll say that I do that with people daily. Again, there may not be any need of tuning cf or your code: until you find WHY requests are slow, you can't solve it. And there could be any of many reasons for the slowness.


    This is where I could help. It's far too much to discuss here, telling you what to look at, how to understand it, how to connect that to possible solutions. I could write an entire book on this (and practically have across all the blog posts, presentations, and forum thread replies here.) 


    But if instead we meet (online, in a  consulting session), I might help you identify and resolve the problem in as little as an hour, and I'd explain things along the way to a) identify and resolve your specific issues(s) and b) help you better understand FR to leverage it more effectively on your own, for use with whatever next problems may arise. If that interests you, find more on my rates, approach, satisfaction guarantee, online calendar, and more at carehart.org/consulting.


    Or you could wait to see if someone might have some darts to throw at the dartboard or might want to lead you on a treasure hunt here. My sense is that neither would be especially productive. But if you really want your problem solved, I'd look forward to helping directly. Then you could report back here as to what was the problem and solution, if you like. 

    /Charlie (troubleshooter, carehart. org)
    New Participant
    July 11, 2024

    Thanks for your response Charlie.

    To add some more information to what I explained previously, we previously had Coldfusion 2016, we switched to Coldfusion 2021 approximately 1 month ago, the first problem we had is that if we have the PMT active, the service completely fails after a few minutes ; Reviewing information in the forums, we noticed that fusion reactor is highly recommended as an alternative to PMT, we tried that program, and exactly the same thing happened to us. Product that if we activate any monitoring tool the service fails, we do not have any monitoring tool other than cfstat. When the service fails, as can be seen in the attached screenshot, you can see that the request running reaches the limit that we have configured. At the database performance level (postgresql), our DBA tells us that in some cases the idle connections to the database are triggered, but this does not always happen. The behavior that can be seen in the capture of the request running, this happens whether any monitoring system is active or not, but if we activate PMT or fusion reactor, this behavior causes the service to fail constantly, now at least it happens but to a lesser extent. measured within the day.

    Charlie Arehart
    Community Expert
    July 11, 2024

    I'm afraid your words here don't get us to any better identification of or resolution to the problem. We still don't even know what it is. And the images you shared are not any sort of "capture of the request". They're the same sort as yesterday.


    And as for your feeling that adding any monitoring only makes things worse, that's an interesting possibility but I suspect there's more to that than meets the eye. 


    In any case, I stand by what I said previously: if you want the problem solved, I'm confident I can help you solve it in a remote session togetherz today or tomorrow. To be clear, there's no reason to concern yourself with "impacting production" while we'd work, so don't presume we could only meet in off hours--though we can arrange that if somehow the hours offered in my online calendar don't suit you. FWIW, I'm on US central time. 

    /Charlie (troubleshooter, carehart. org)