Inspiring
February 19, 2020
Answered

Blank page when debug CEP panel in google chrome

  • February 19, 2020
  • 1 reply
  • 2372 views

Hi,

is the debugging with chrome still works?

I am trying to debug a panel I want to make some chnaeg to.

I havn't chnages anything (aprat from updating PS to 2020 and probably google chrome) from the last time I successfully debugged it, which was 4 months ago.


Now i get a blank page after i press teh panle link name.

Tried download chromium but it als give me a blanck page.


I see this error in the inspect panel:
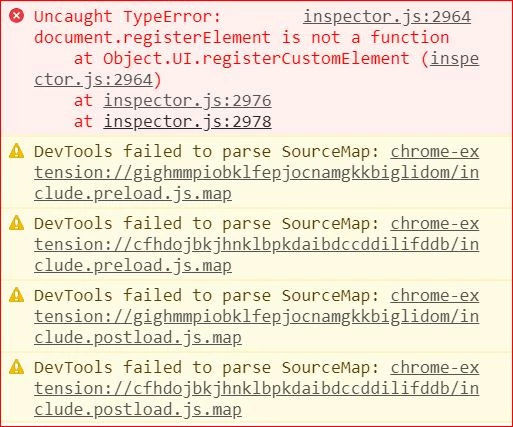
 

What can I do/try?

This topic has been closed for replies.
Correct answer danl42831687

I found a workaround.


Download "Cefclient" from:

https://github.com/Adobe-CEP/CEP-Resources/tree/master/CEP_9.x 


then extract and run:

...\Cefclient_Win64\cef_binary_3.3239.1723.g071d1c1_windows64_client\Release\cefclient.exe


It will open a browser like windows were you should paste your locahostIP

1 reply

dmitryp63061491
New Participant
February 20, 2020

I also had this problem about 2 weeks ago.

Photoshop has been updated to version 2020 and chrome is also the latest version.
The console produces a similar error and a white screen

danl42831687AuthorCorrect answer
Inspiring
February 20, 2020

I found a workaround.


Download "Cefclient" from:

https://github.com/Adobe-CEP/CEP-Resources/tree/master/CEP_9.x 


then extract and run:

...\Cefclient_Win64\cef_binary_3.3239.1723.g071d1c1_windows64_client\Release\cefclient.exe


It will open a browser like windows were you should paste your locahostIP

dmitryp63061491
New Participant
February 20, 2020

Thx)