New Participant
February 6, 2020
Question

Debugger fails to load in the latest Chrome

  • February 6, 2020
  • 2 replies
  • 802 views

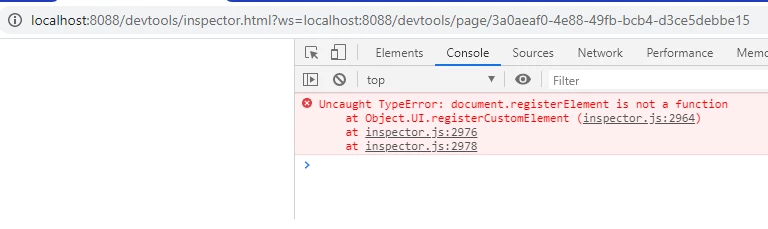
I noticed this issue yesterday when triying to debug an html extension. When launching the debuger (in my case localhost:8088), you'll see the initial page w/ 'Inspectable WebContent' title and the link to your extension, but when you click on the link the browser loads only an empty page (see below). Before yesterday opening a debugger wasn't a problem. The only change I see is Chrome was updated (80.0.3987.87). It doesn't matter what host app you're using for your extension, the debugger has the same problem.

Is this a known issue?


    This topic has been closed for replies.

    2 replies

    Karmalakas
    Known Participant
    March 9, 2020

    Same here. Few days ago added CEP 9.x Sanple extension, changed registry and had same JS errors.

    Here's what I get with panel open in Ps:


    And here's, when I click on index.html:


    Latest Win 10 x64

    Latest Chrome

    Latest Ps CC

    Inspiring
    August 5, 2020

    I try to get remote debugging working for my extension, The Inspectable WebContents page loads, onces clicked, a blank page.

    I'm new to the chrome dev tools, but all instructions I found, I should see these dev tools when the link is clicked on... right?

    On another PC, for some reason, it won't even find "http://localhost:8088/" on the same extension.

    Adobe, any updates on how we can debug JSX from an PS extension at this moment?

    The only way I can notice something is wrong is when the UI font changes of the extension, and JSX silently errors.

    New Participant
    February 13, 2020

    Having the same problem since yesterday. Really annoying since there is no other way to watch what happens in the app besides alerts 😞